HSBC 2005 Annual Report Download - page 298
Download and view the complete annual report
Please find page 298 of the 2005 HSBC annual report below. You can navigate through the pages in the report by either clicking on the pages listed below, or by using the keyword search tool below to find specific information within the annual report.-
 1
1 -
2
-
3
-
4
-
5
-
6
-
7
-
8
-
9
-
10
-
11
-
12
-
13
-
14
-
15
-
16
-
17
-
18
-
19
-
20
-
21
-
22
-
23
-
24
-
25
-
26
-
27
-
28
-
29
-
30
-
31
-
32
-
33
-
34
-
35
-
36
-
37
-
38
-
39
-
40
-
41
-
42
-
43
-
44
-
45
-
46
-
47
-
48
-
49
-
50
-
51
-
52
-
53
-
54
-
55
-
56
-
57
-
58
-
59
-
60
-
61
-
62
-
63
-
64
-
65
-
66
-
67
-
68
-
69
-
70
-
71
-
72
-
73
-
74
-
75
-
76
-
77
-
78
-
79
-
80
-
81
-
82
-
83
-
84
-
85
-
86
-
87
-
88
-
89
-
90
-
91
-
92
-
93
-
94
-
95
-
96
-
97
-
98
-
99
-
100
-
101
-
102
-
103
-
104
-
105
-
106
-
107
-
108
-
109
-
110
-
111
-
112
-
113
-
114
-
115
-
116
-
117
-
118
-
119
-
120
-
121
-
122
-
123
-
124
-
125
-
126
-
127
-
128
-
129
-
130
-
131
-
132
-
133
-
134
-
135
-
136
-
137
-
138
-
139
-
140
-
141
-
142
-
143
-
144
-
145
-
146
-
147
-
148
-
149
-
150
-
151
-
152
-
153
-
154
-
155
-
156
-
157
-
158
-
159
-
160
-
161
-
162
-
163
-
164
-
165
-
166
-
167
-
168
-
169
-
170
-
171
-
172
-
173
-
174
-
175
-
176
-
177
-
178
-
179
-
180
-
181
-
182
-
183
-
184
-
185
-
186
-
187
-
188
-
189
-
190
-
191
-
192
-
193
-
194
-
195
-
196
-
197
-
198
-
199
-
200
-
201
-
202
-
203
-
204
-
205
-
206
-
207
-
208
-
209
-
210
-
211
-
212
-
213
-
214
-
215
-
216
-
217
-
218
-
219
-
220
-
221
-
222
-
223
-
224
-
225
-
226
-
227
-
228
-
229
-
230
-
231
-
232
-
233
-
234
-
235
-
236
-
237
-
238
-
239
-
240
-
241
-
242
-
243
-
244
-
245
-
246
-
247
-
248
-
249
-
250
-
251
-
252
-
253
-
254
-
255
-
256
-
257
-
258
-
259
-
260
-
261
-
262
-
263
-
264
-
265
-
266
-
267
-
268
-
269
-
270
-
271
-
272
-
273
-
274
-
275
-
276
-
277
-
278
-
279
-
280
-
281
-
282
-
283
-
284
-
285
-
286
-
287
-
 288
288 -
 289
289 -
 290
290 -
 291
291 -
 292
292 -
 293
293 -
 294
294 -
 295
295 -
 296
296 -
 297
297 -
 298
298 -
 299
299 -
 300
300 -
 301
301 -
 302
302 -
 303
303 -
 304
304 -
 305
305 -
 306
306 -
 307
307 -
 308
308 -
309
-
310
-
311
-
312
-
313
-
314
-
315
-
316
-
317
-
318
-
319
-
320
-
321
-
322
-
323
-
324
-
325
-
326
-
327
-
328
-
329
-
330
-
331
-
332
-
333
-
334
-
335
-
336
-
337
-
338
-
339
-
340
-
341
-
342
-
343
-
344
-
345
-
346
-
347
-
348
-
349
-
350
-
351
-
352
-
353
-
354
-
355
-
356
-
357
-
358
-
359
-
360
-
361
-
362
-
363
-
364
-
365
-
366
-
367
-
368
-
369
-
370
-
371
-
372
-
373
-
374
-
375
-
376
-
377
-
378
-
379
-
380
-
381
-
382
-
383
-
384
-
385
-
386
-
387
-
388
-
389
-
390
-
391
-
392
-
393
-
394
-
395
-
396
-
397
-
398
-
399
-
400
-
401
-
402
-
403
-
404
-
405
-
406
-
407
-
408
-
409
-
410
-
411
-
412
-
413
-
414
-
415
-
416
-
417
-
418
-
419
-
420
-
421
-
422
-
423
-
424
 |
 |

HSBC HOLDINGS PLC
Notes on the Financial Statements (continued)
296
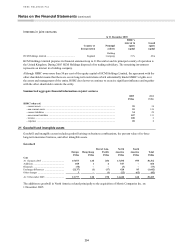
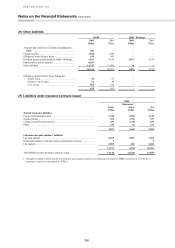
Other intangible assets
The analysis of the movement of intangible assets, excluding the present value of in-force long-term insurance
business, for the year ended 31 December 2005 is as follows:
Trade
names
Mortgage
servicing
rights
Internally
generated
software
Purchased
software
Customer/
merchant
relation-
ships Other Total
US$m US$m US$m US$m US$m US$m US$m
Cost
At 1 January 2005 ..................... 41 791 1,823 210 764 393 4,022
Additions1 ................................. – 136 420 49 13 8 626
Acquisition of subsidiaries ........ – – – – 271 – 271
Disposals ................................... – – – (63) (15) (1) (79)
Exchange differences ................. 2 2 (104) (19) (72) (44) (235)
Other changes ............................ – 50 (45) 118 73 17 213
At 31 December 2005 ................ 43 979 2,094 295 1,034 373 4,818
Accumulated amortisation
At 1 January 2005 ..................... (8) (474) (1,064) (115) (95) (7) (1,763)
Charge for the year2 ................... (6) (27) (354) (76) (99) (19) (581)
Disposals ................................... –––29––29
Exchange differences ................ (1) 1 123 (37) 5 2 93
Other changes ............................ – (60) (6) 29 16 – (21)
At 31 December 2005 ............... (15) (560) (1,301) (170) (173) (24) (2,243)
Net carrying amount at
31 December 2005 ................ 28 419 793 125 861 349 2,575
Cost
At 1 January 2004 ..................... 20 854 1,556 159 490 13 3,092
Additions1 ................................. 15 67 314 47 259 23 725
Acquisition of subsidiaries ........ – – – – 3 – 3
Disposals ................................... – (54) (4) (6) – (1) (65)
Exchange differences ................ 6 2 67 4 12 8 99
Other changes ............................ – (78) (110) 6 – 350 168
At 31 December 2004 41 791 1,823 210 764 393 4,022
Accumulated amortisation
At 1 January 2004 ..................... – (364) (804) (87) 5 (1) (1,251)
Charge for the year2 ................... (5) (205) (379) (27) (78) (5) (699)
Disposals ................................... – – – 2 – – 2
Impairment losses ...................... – (15) – – – – (15)
Exchange differences ................ – (1) 9 2 – (1) 9
Other changes ............................ (3) 111 110 (5) (22) – 191
At 31 December 2004 ............... (8) (474) (1,064) (115) (95) (7) (1,763)
Net carrying amount at
31 December 2004 ................ 33 317 759 95 669 386 2,259
1At 31 December 2005, HSBC had US$56 million (2004: US$95 million) of contractual commitments to acquire intangible assets.
2The amortisation charge for the year is recognised within the income statement under ‘Amortisation of intangible assets’, with the
exception of the amortisation of mortgage servicing rights that are charged to net fee income.
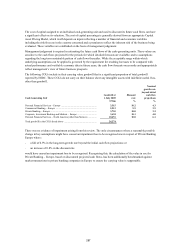
22 Impairment of assets other than financial instruments
During 2005 there was no impairment of goodwill (2004: US$nil). Impairment testing in respect of goodwill is
performed annually by comparing the recoverable amount of cash generating units (‘CGUs’) that has been
determined at 1 July 2005 based on a value in use calculation. That calculation uses cash flow estimates based on
management’s cash flow projections, extrapolated in perpetuity using a nominal long-term growth rate based on
current GDP and inflation for the countries within which the CGU operates. The discount rate used is based on the
cost of capital HSBC allocates to investments in the countries within which the CGU operates.