HSBC 2005 Annual Report Download - page 266
Download and view the complete annual report
Please find page 266 of the 2005 HSBC annual report below. You can navigate through the pages in the report by either clicking on the pages listed below, or by using the keyword search tool below to find specific information within the annual report.-
 1
1 -
2
-
3
-
4
-
5
-
6
-
7
-
8
-
9
-
10
-
11
-
12
-
13
-
14
-
15
-
16
-
17
-
18
-
19
-
20
-
21
-
22
-
23
-
24
-
25
-
26
-
27
-
28
-
29
-
30
-
31
-
32
-
33
-
34
-
35
-
36
-
37
-
38
-
39
-
40
-
41
-
42
-
43
-
44
-
45
-
46
-
47
-
48
-
49
-
50
-
51
-
52
-
53
-
54
-
55
-
56
-
57
-
58
-
59
-
60
-
61
-
62
-
63
-
64
-
65
-
66
-
67
-
68
-
69
-
70
-
71
-
72
-
73
-
74
-
75
-
76
-
77
-
78
-
79
-
80
-
81
-
82
-
83
-
84
-
85
-
86
-
87
-
88
-
89
-
90
-
91
-
92
-
93
-
94
-
95
-
96
-
97
-
98
-
99
-
100
-
101
-
102
-
103
-
104
-
105
-
106
-
107
-
108
-
109
-
110
-
111
-
112
-
113
-
114
-
115
-
116
-
117
-
118
-
119
-
120
-
121
-
122
-
123
-
124
-
125
-
126
-
127
-
128
-
129
-
130
-
131
-
132
-
133
-
134
-
135
-
136
-
137
-
138
-
139
-
140
-
141
-
142
-
143
-
144
-
145
-
146
-
147
-
148
-
149
-
150
-
151
-
152
-
153
-
154
-
155
-
156
-
157
-
158
-
159
-
160
-
161
-
162
-
163
-
164
-
165
-
166
-
167
-
168
-
169
-
170
-
171
-
172
-
173
-
174
-
175
-
176
-
177
-
178
-
179
-
180
-
181
-
182
-
183
-
184
-
185
-
186
-
187
-
188
-
189
-
190
-
191
-
192
-
193
-
194
-
195
-
196
-
197
-
198
-
199
-
200
-
201
-
202
-
203
-
204
-
205
-
206
-
207
-
208
-
209
-
210
-
211
-
212
-
213
-
214
-
215
-
216
-
217
-
218
-
219
-
220
-
221
-
222
-
223
-
224
-
225
-
226
-
227
-
228
-
229
-
230
-
231
-
232
-
233
-
234
-
235
-
236
-
237
-
238
-
239
-
240
-
241
-
242
-
243
-
244
-
245
-
246
-
247
-
248
-
249
-
250
-
251
-
252
-
253
-
254
-
255
-
 256
256 -
 257
257 -
 258
258 -
 259
259 -
 260
260 -
 261
261 -
 262
262 -
 263
263 -
 264
264 -
 265
265 -
 266
266 -
 267
267 -
 268
268 -
 269
269 -
 270
270 -
 271
271 -
 272
272 -
 273
273 -
 274
274 -
 275
275 -
 276
276 -
277
-
278
-
279
-
280
-
281
-
282
-
283
-
284
-
285
-
286
-
287
-
288
-
289
-
290
-
291
-
292
-
293
-
294
-
295
-
296
-
297
-
298
-
299
-
300
-
301
-
302
-
303
-
304
-
305
-
306
-
307
-
308
-
309
-
310
-
311
-
312
-
313
-
314
-
315
-
316
-
317
-
318
-
319
-
320
-
321
-
322
-
323
-
324
-
325
-
326
-
327
-
328
-
329
-
330
-
331
-
332
-
333
-
334
-
335
-
336
-
337
-
338
-
339
-
340
-
341
-
342
-
343
-
344
-
345
-
346
-
347
-
348
-
349
-
350
-
351
-
352
-
353
-
354
-
355
-
356
-
357
-
358
-
359
-
360
-
361
-
362
-
363
-
364
-
365
-
366
-
367
-
368
-
369
-
370
-
371
-
372
-
373
-
374
-
375
-
376
-
377
-
378
-
379
-
380
-
381
-
382
-
383
-
384
-
385
-
386
-
387
-
388
-
389
-
390
-
391
-
392
-
393
-
394
-
395
-
396
-
397
-
398
-
399
-
400
-
401
-
402
-
403
-
404
-
405
-
406
-
407
-
408
-
409
-
410
-
411
-
412
-
413
-
414
-
415
-
416
-
417
-
418
-
419
-
420
-
421
-
422
-
423
-
424
 |
 |

HSBC HOLDINGS PLC
Notes on the Financial Statements (continued)
264
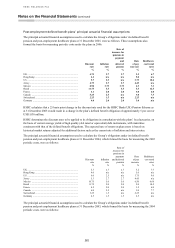
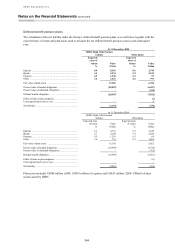
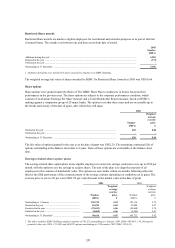
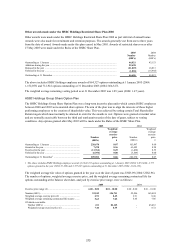
Defined benefit pension plans
The calculation of the net liability under the Group’s defined benefit pension plans is set out below together with the
expected rates of return and plan assets used to measure the net defined benefit pension costs in each subsequent
year:
At 31 December 2005
HSBC Bank (UK) Pension
Scheme Other plans
Expected
rates of
return Value
Expected
rates of
return Value
%US$m %US$m
Equities ............................................................................ 8.0 8,181 8.6 2,749
Bonds ............................................................................... 4.3 5,234 5.2 2,539
Property ............................................................................ 6.5 1,540 6.5 97
Other ................................................................................ 3.6 2,441 4.6 971
Fair value of plan assets ................................................... 17,396 6,356
Present value of funded obligations .................................. (20,587) (6,687)
Present value of unfunded obligations .............................. – (415)
Defined benefit obligation ................................................ (20,587) (7,102)
Effect of limit on plan surpluses ....................................... –(7)
Unrecognised past service cost ......................................... –3
Net liability ....................................................................... (3,191) (750)
At 31 December 2004
HSBC Bank (UK) Pension
Scheme Other plans
Expected rates
of return Value
Expected rates
of return Value
%US$m %US$m
Equities ............................................................................ 8.1 8,718 9.5 2,649
Bonds ............................................................................... 4.7 4,100 5.5 2,044
Property ............................................................................ 6.5 1,536 6.5 68
Other ................................................................................ 3.6 751 4.5 1,062
Fair value of plan assets ................................................... 15,105 5,823
Present value of funded obligations .................................. (19,988) (5,739)
Present value of unfunded obligations .............................. – (762)
Defined benefit obligation ................................................ (19,988) (6,501)
Effect of limit on plan surpluses ....................................... – (11)
Unrecognised past service cost ......................................... – –
Net liability ....................................................................... (4,883) (689)
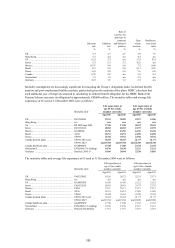
Plan assets included US$80 million (2004: US$76 million) of equities and US$53 million (2004: US$nil) of other
assets issued by HSBC.