EasyJet 2015 Annual Report Download - page 83
Download and view the complete annual report
Please find page 83 of the 2015 EasyJet annual report below. You can navigate through the pages in the report by either clicking on the pages listed below, or by using the keyword search tool below to find specific information within the annual report.-
 1
1 -
2
-
3
-
4
-
5
-
6
-
7
-
8
-
9
-
10
-
11
-
12
-
13
-
14
-
15
-
16
-
17
-
18
-
19
-
20
-
21
-
22
-
23
-
24
-
25
-
26
-
27
-
28
-
29
-
30
-
31
-
32
-
33
-
34
-
35
-
36
-
37
-
38
-
39
-
40
-
41
-
42
-
43
-
44
-
45
-
46
-
47
-
48
-
49
-
50
-
51
-
52
-
53
-
54
-
55
-
56
-
57
-
58
-
59
-
60
-
61
-
62
-
63
-
64
-
65
-
66
-
67
-
68
-
69
-
70
-
71
-
72
-
 73
73 -
 74
74 -
 75
75 -
 76
76 -
 77
77 -
 78
78 -
 79
79 -
 80
80 -
 81
81 -
 82
82 -
 83
83 -
 84
84 -
 85
85 -
 86
86 -
 87
87 -
 88
88 -
 89
89 -
 90
90 -
 91
91 -
 92
92 -
 93
93 -
94
-
95
-
96
-
97
-
98
-
99
-
100
-
101
-
102
-
103
-
104
-
105
-
106
-
107
-
108
-
109
-
110
-
111
-
112
-
113
-
114
-
115
-
116
-
117
-
118
-
119
-
120
-
121
-
122
-
123
-
124
-
125
-
126
-
127
-
128
-
129
-
130
 |
 |
Strategic report Governance Accounts
79
www.easyJet.com
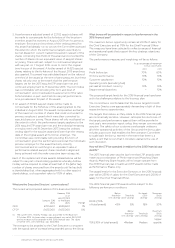
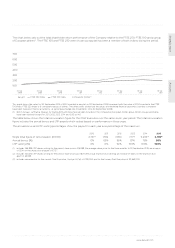
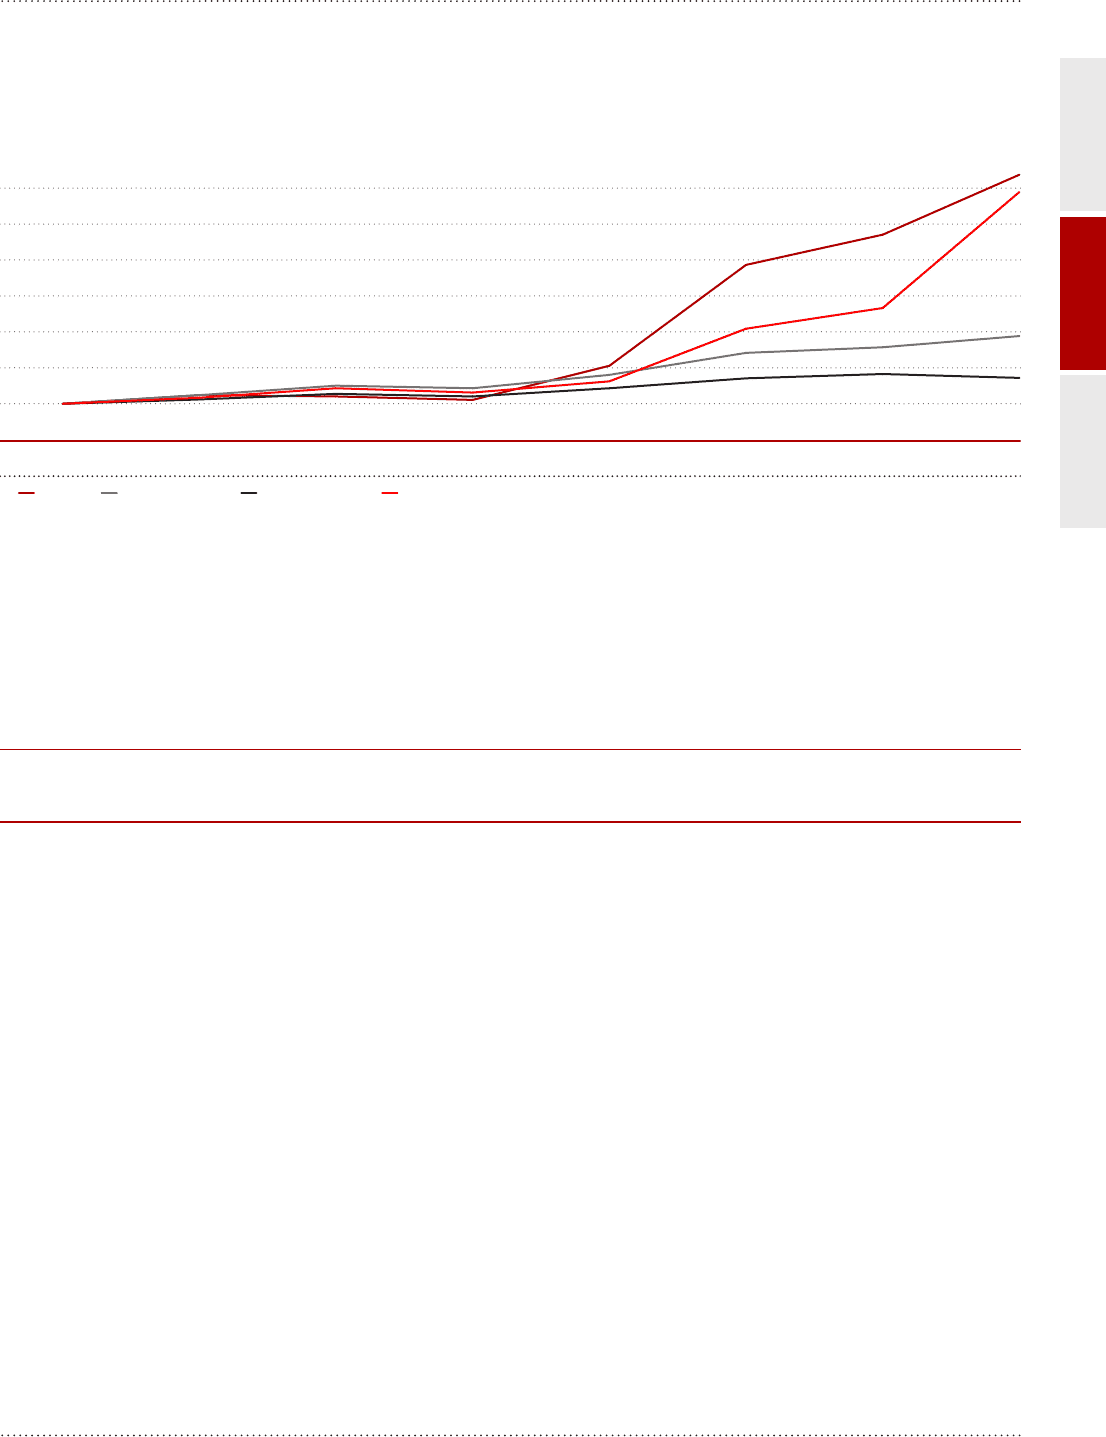
Review of past performance
The chart below sets out the total shareholder return performance of the Company relative to the FTSE 250, FTSE 100 and a group
of European airlines(1). The FTSE 100 and FTSE 250 were chosen as easyJet has been a member of both indices during the period.
TOTAL SHAREHOLDER RETURN
VALUE (LOCAL CURRENCY)
100
30 Sep
2015
30 Sep
2014
30 Sep
2013
30 Sep
2012
30 Sep
2011
30 Sep
2010
30 Sep
2009
30 Sep
2008
easyjet FTSE 250 Index FTSE 100 Index Comparator Airlines(1)
200
300
400
500
600
700
This graph shows the value, by 30 September 2015 of £100 invested in easyJet on 30 September 2008 compared with the value of £100 invested in the FTSE
100 Index, FTSE 250 Index or a comparator group of airlines. The other points plotted are the values at intervening financial year ends (overseas companies
have been tracked in their local currency, i.e. ignoring exchange rate movements since 30 September 2008).
(1) British Airways, Lufthansa, Ryanair, Air France-KLM and Iberia have all been included in the comparative European Airlines group. British Airways and Iberia
have been tracked forward for 2011, 2012, 2013, 2014 and 2015 as IAG.
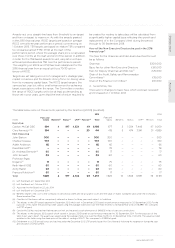
The table below shows the total remuneration figure for the Chief Executive over the same seven year period. The total remuneration
figure includes the annual bonus and LTIP awards which vested based on performance in those years.
The annual bonus and LTIP vesting percentages show the payout for each year as a percentage of the maximum.
2010 2011 2012 2013 2014 2015
Single total figure of remuneration (£’000) 2,741(3) 1,552 3,694 7,777 9,209(2) 6,198(1)
Annual bonus (%) 0% 63% 96% 87% 76% 66%
LTIP vesting (%) 0% 0% 92% 100% 100% 100%
(1) Includes 266,899 LTIP shares vesting for the period, share price is £16.988 (the average share price for the three months to 30 September 2015) an increase
of 130% on the share price at grant of £7.37.
(2) Includes 445,575 LTIP shares vesting for the period, share price was £16.71 (the actual share price at vesting) an increase of 325% on the share price at
grant of £3.928.
(3) Includes remuneration for the current Chief Executive, Carolyn McCall, of £178,000 and for the former Chief Executive of £2,563,000.