EasyJet 2015 Annual Report Download - page 114
Download and view the complete annual report
Please find page 114 of the 2015 EasyJet annual report below. You can navigate through the pages in the report by either clicking on the pages listed below, or by using the keyword search tool below to find specific information within the annual report.-
 1
1 -
2
-
3
-
4
-
5
-
6
-
7
-
8
-
9
-
10
-
11
-
12
-
13
-
14
-
15
-
16
-
17
-
18
-
19
-
20
-
21
-
22
-
23
-
24
-
25
-
26
-
27
-
28
-
29
-
30
-
31
-
32
-
33
-
34
-
35
-
36
-
37
-
38
-
39
-
40
-
41
-
42
-
43
-
44
-
45
-
46
-
47
-
48
-
49
-
50
-
51
-
52
-
53
-
54
-
55
-
56
-
57
-
58
-
59
-
60
-
61
-
62
-
63
-
64
-
65
-
66
-
67
-
68
-
69
-
70
-
71
-
72
-
73
-
74
-
75
-
76
-
77
-
78
-
79
-
80
-
81
-
82
-
83
-
84
-
85
-
86
-
87
-
88
-
89
-
90
-
91
-
92
-
93
-
94
-
95
-
96
-
97
-
98
-
99
-
100
-
101
-
102
-
103
-
 104
104 -
 105
105 -
 106
106 -
 107
107 -
 108
108 -
 109
109 -
 110
110 -
 111
111 -
 112
112 -
 113
113 -
 114
114 -
 115
115 -
 116
116 -
 117
117 -
 118
118 -
 119
119 -
 120
120 -
 121
121 -
 122
122 -
 123
123 -
 124
124 -
125
-
126
-
127
-
128
-
129
-
130
 |
 |

110 easyJet plc Annual report and accounts 2015
Notes to the accounts continued
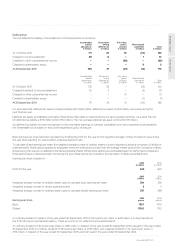
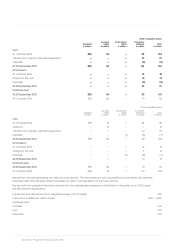
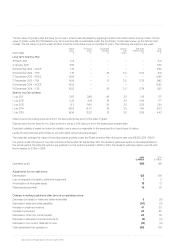
18. Share incentive schemes continued
The fair value of grants under the Save As You Earn scheme are calculated by applying the Binomial Lattice option pricing model. The fair
value of grants under the TSR based Long Term Incentive Plan is estimated under the Stochastic model (also known as the Monte Carlo
model). The fair value of grants under all other schemes is the share price on the date of grant. The following assumptions are used:
Grant date
Share
price
£
Exercise
price
£
Expected
volatility
%
Option
life
years
Risk-free
interest rate
%
Fair
value
£
Long Term Incentive Plan
31 March 2011 3.41 – – – – 3.41
4 January 2012 3.92 – – – – 3.92
18 December 2012 – ROCE 7.37 – – – – 6.92
18 December 2012 – TSR 7.37 – 33 3.0 0.44 5.16
17 December 2013 – ROCE 14.99 – – – – 14.99
17 December 2013 – TSR 14.99 – 31 3.0 0.76 9.83
19 December 2014 – ROCE 16.52 – – – – 16.52
19 December 2014 – TSR 16.52 – 29 3.0 0.78 11.65
Save As You Earn scheme
1 July 2011 3.60 2.88 46 3.5 1.45 1.37
1 July 2012 5.23 4.18 35 3.5 0.24 1.77
1 July 2013 12.11 9.69 34 3.5 0.32 3.54
1 July 2014 16.62 13.30 33 3.5 1.64 5.03
1 July 2015 16.54 13.23 31 3.5 0.95 4.42
Share price is the closing share price from the last working day prior to the date of grant.
Exercise price for the Save As You Earn scheme is set at a 20% discount from the share price at grant date.
Expected volatility is based on historical volatility over a period comparable to the expected life of each type of option.
Levels of early exercises and forfeitures are estimated using historical averages.
The weighted average fair value of matching shares granted under the Share Incentive Plan during the year was £16.69 (2014: £14.61).
For grants under the Save As You Earn scheme scheme after 30 September 2011, the dividend yield assumption is calculated based on
the actual yield at the date the options are granted. For the options granted in 2012 to 2014, the dividend yield assumption was 2% and
this increased to 2.75% in 2015.
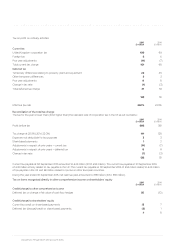
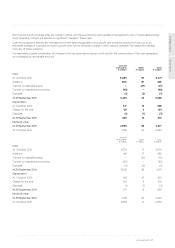
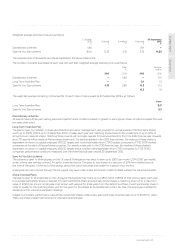
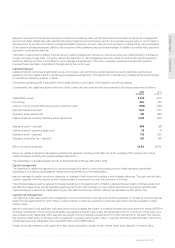
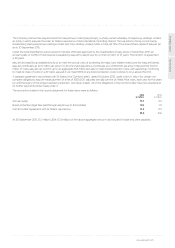
19. Reconciliation of operating profit to cash generated from operations
2015
£ million 2014
£ million
Operating profit 688 581
Adjustments for non-cash items:
Depreciation 125 106
Loss on disposal of property, plant and equipment 1 2
Amortisation of intangible assets 13 12
Share-based payments 18 23
Changes in working capital and other items of an operating nature:
Decrease /(increase) in trade and other receivables 5 (6)
Decrease in trade and other payables (30) (5)
Increase in unearned revenue 47 25
Increase in provisions 23 30
Decrease in other non-current assets 22 33
Decrease in derivative financial instruments (2) (2)
Decrease in non-current deferred income (15) (6)
Cash generated from operations 895 793