EasyJet 2015 Annual Report Download - page 27
Download and view the complete annual report
Please find page 27 of the 2015 EasyJet annual report below. You can navigate through the pages in the report by either clicking on the pages listed below, or by using the keyword search tool below to find specific information within the annual report.-
 1
1 -
2
-
3
-
4
-
5
-
6
-
7
-
8
-
9
-
10
-
11
-
12
-
13
-
14
-
15
-
16
-
 17
17 -
 18
18 -
 19
19 -
 20
20 -
 21
21 -
 22
22 -
 23
23 -
 24
24 -
 25
25 -
 26
26 -
 27
27 -
 28
28 -
 29
29 -
 30
30 -
 31
31 -
 32
32 -
 33
33 -
 34
34 -
 35
35 -
 36
36 -
 37
37 -
38
-
39
-
40
-
41
-
42
-
43
-
44
-
45
-
46
-
47
-
48
-
49
-
50
-
51
-
52
-
53
-
54
-
55
-
56
-
57
-
58
-
59
-
60
-
61
-
62
-
63
-
64
-
65
-
66
-
67
-
68
-
69
-
70
-
71
-
72
-
73
-
74
-
75
-
76
-
77
-
78
-
79
-
80
-
81
-
82
-
83
-
84
-
85
-
86
-
87
-
88
-
89
-
90
-
91
-
92
-
93
-
94
-
95
-
96
-
97
-
98
-
99
-
100
-
101
-
102
-
103
-
104
-
105
-
106
-
107
-
108
-
109
-
110
-
111
-
112
-
113
-
114
-
115
-
116
-
117
-
118
-
119
-
120
-
121
-
122
-
123
-
124
-
125
-
126
-
127
-
128
-
129
-
130
 |
 |
Strategic report Governance Accounts
23
www.easyJet.com
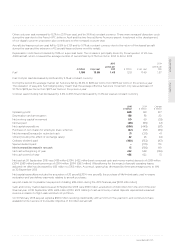
ating measures
2015 2014
Increase/
(decrease)
Seats flown (millions) 75.0 71.5 4.9%
Passengers (millions) 68.6 64.8 6.0%
Load factor 91.5% 90.6% +0.9ppt
Available seat kilometres (ASK) (millions) 83,846 79,525 5.4%
Revenue passenger kilometres (RPK) (millions) 77,619 72,933 6.4%
Average sector length (kilometres) 1,118 1,112 0.5%
Sectors 457,479 439,943 4.0%
Block hours 892,052 849,790 5.0%
Number of aircraft owned/leased at end of year 241 226 6.6%
Average number of aircraft owned/leased during year 232.6 220.8 5.3%
Number of aircraft operated at end of year 233 217 7.4%
Average number of aircraft operated during year 221.1 210.8 4.9%
Operated aircraft utilisation (hours per day) 11.1 11.0 0.5%
Owned aircraft utilisation (hours per day) 10.5 10.6 (0.9%)
Number of routes operated at end of year 735 675 8.9%
Number of airports served at end of year 136 135 0.7%
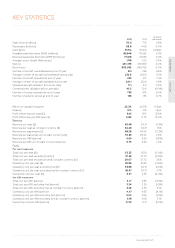
inancial measures
Return on capital employed 22.2% 20.5% +1.7ppt
Gearing 14% 17% -3ppt
Profit before tax per seat (£) 9.15 8.12 12.6%
Profit before tax per ASK (pence) 0.82 0.73 12.0%
evenue
Revenue per seat (£) 62.48 63.31 (1.3%)
Revenue per seat at constant currency (£) 64.28 63.31 1.5%
Revenue per passenger (£) 68.28 69.90 (2.3%)
Revenue per passenger at constant currency (£) 70.25 69.90 0.5%
Revenue per ASK (pence) 5.59 5.69 (1.8%)
Revenue per ASK at constant currency (pence) 5.75 5.69 1.0%
er seat measures
Total cost per seat (£) 53.33 55.19 (3.4%)
Total cost per seat excluding fuel (£) 37.35 37.70 (0.9%)
Total cost per seat excluding fuel at constant currency (£) 39.07 37.70 3.6%
Operating cost per seat (£) 49.96 51.80 (3.6%)
Operating cost per seat excluding fuel (£) 33.98 34.31 (1.0%)
Operating cost per seat excluding fuel at constant currency (£) 35.57 34.31 3.7%
Ownership cost per seat (£) 3.37 3.39 (0.4%)
er SK measures
Total cost per ASK (pence) 4.77 4.96 (3.9%)
Total cost per ASK excluding fuel (pence) 3.34 3.39 (1.5%)
Total cost per ASK excluding fuel at constant currency (pence) 3.49 3.39 3.1%
Operating cost per ASK (pence) 4.47 4.65 (4.1%)
Operating cost per ASK excluding fuel (pence) 3.04 3.08 (1.5%)
Operating cost per ASK excluding fuel at constant currency (pence) 3.18 3.08 3.1%
Ownership cost per ASK (pence) 0.30 0.31 (1.0%)
KEY STATISTICS