EasyJet 2015 Annual Report Download - page 22
Download and view the complete annual report
Please find page 22 of the 2015 EasyJet annual report below. You can navigate through the pages in the report by either clicking on the pages listed below, or by using the keyword search tool below to find specific information within the annual report.-
 1
1 -
2
-
3
-
4
-
5
-
6
-
7
-
8
-
9
-
10
-
11
-
 12
12 -
 13
13 -
 14
14 -
 15
15 -
 16
16 -
 17
17 -
 18
18 -
 19
19 -
 20
20 -
 21
21 -
 22
22 -
 23
23 -
 24
24 -
 25
25 -
 26
26 -
 27
27 -
 28
28 -
 29
29 -
 30
30 -
 31
31 -
 32
32 -
33
-
34
-
35
-
36
-
37
-
38
-
39
-
40
-
41
-
42
-
43
-
44
-
45
-
46
-
47
-
48
-
49
-
50
-
51
-
52
-
53
-
54
-
55
-
56
-
57
-
58
-
59
-
60
-
61
-
62
-
63
-
64
-
65
-
66
-
67
-
68
-
69
-
70
-
71
-
72
-
73
-
74
-
75
-
76
-
77
-
78
-
79
-
80
-
81
-
82
-
83
-
84
-
85
-
86
-
87
-
88
-
89
-
90
-
91
-
92
-
93
-
94
-
95
-
96
-
97
-
98
-
99
-
100
-
101
-
102
-
103
-
104
-
105
-
106
-
107
-
108
-
109
-
110
-
111
-
112
-
113
-
114
-
115
-
116
-
117
-
118
-
119
-
120
-
121
-
122
-
123
-
124
-
125
-
126
-
127
-
128
-
129
-
130
 |
 |

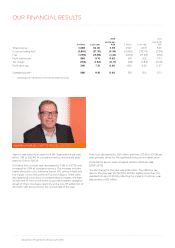
18 easyJet plc Annual report and accounts 2015
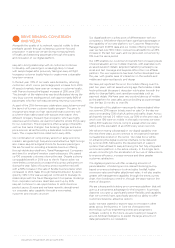
Financial review
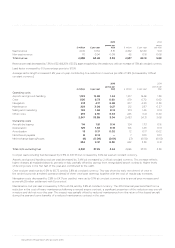
Year-on-year seats flown grew by 4.9%. Total revenue per seat
fell by 1.3% to £62.48. At constant currency, revenue per seat
grew by 1.5% to £64.28.
Excluding fuel, cost per seat decreased by 0.9% to £37.35, and
increased by 3.6% at constant currency. This increase includes
higher disruption costs following French ATC strikes in April and
the impact of two fires at Rome Fiumicino airport. There were
also additional costs due to increased airport charges, the early
recruitment of crew in the winter to provide a resilient operation
ahead of three crew base openings, and a one-off settlement of
£8 million with Eurocontrol in the second half of the year.
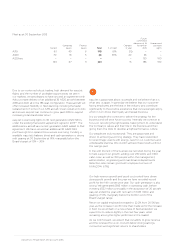
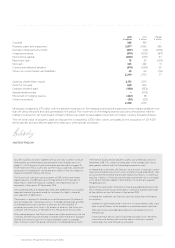
OUR FINANCIAL RESULTS
In the 2015 financial year, easyJet flew
68.6 million passengers (2014: 64.8 million)
and grew profit before tax by 18.1% to
£686 million. Profit after tax was £548
million, an increase of 21.8% over last year.
Basic earnings per share increased 21.5%
to 139.1 pence.
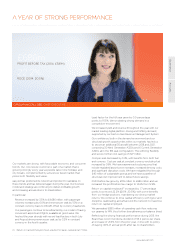
ANDREW FINDLAY, CHIEF FINANCIAL OFFICER
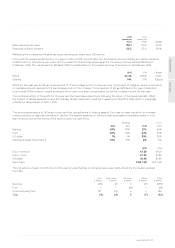
FINANCIAL OVERVIEW
2015 2014
£ million £ per seat
pence per
ASK £ million £ per seat
pence per
ASK
Total revenue 4,686 62.48 5.59 4,527 63.31 5.69
Costs excluding fuel (2,801) (37.35) (3.34) (2,695) (37.70) (3.39)
Fuel (1,199) (15.98) (1.43) (1,251) (17.49) (1.57)
Profit before tax 686 9.15 0.82 581 8.12 0.73
Tax charge (138) (1.84) (0.17) (131) (1.83) (0.16)
Profit after tax 548 7.31 0.65 450 6.29 0.57
Operating profit* 688 9.18 0.82 581 8.12 0.73
* Operating profit represents profit before interest and tax.
Fuel costs decreased by £52 million, and from £17.49 to £15.98 per
seat, primarily driven by the significant reduction in market price.
Profit before tax per seat increased 12.6% to £9.15 per seat
(2014: £8.12).
The tax charge for the year was £138 million. The effective tax
rate for the year was 20.1% (2014: 22.5%), slightly lower than the
standard UK rate of 20.5%, reflecting the impact of net prior year
adjustments of £6 million.