EasyJet 2015 Annual Report Download - page 109
Download and view the complete annual report
Please find page 109 of the 2015 EasyJet annual report below. You can navigate through the pages in the report by either clicking on the pages listed below, or by using the keyword search tool below to find specific information within the annual report.-
 1
1 -
2
-
3
-
4
-
5
-
6
-
7
-
8
-
9
-
10
-
11
-
12
-
13
-
14
-
15
-
16
-
17
-
18
-
19
-
20
-
21
-
22
-
23
-
24
-
25
-
26
-
27
-
28
-
29
-
30
-
31
-
32
-
33
-
34
-
35
-
36
-
37
-
38
-
39
-
40
-
41
-
42
-
43
-
44
-
45
-
46
-
47
-
48
-
49
-
50
-
51
-
52
-
53
-
54
-
55
-
56
-
57
-
58
-
59
-
60
-
61
-
62
-
63
-
64
-
65
-
66
-
67
-
68
-
69
-
70
-
71
-
72
-
73
-
74
-
75
-
76
-
77
-
78
-
79
-
80
-
81
-
82
-
83
-
84
-
85
-
86
-
87
-
88
-
89
-
90
-
91
-
92
-
93
-
94
-
95
-
96
-
97
-
98
-
 99
99 -
 100
100 -
 101
101 -
 102
102 -
 103
103 -
 104
104 -
 105
105 -
 106
106 -
 107
107 -
 108
108 -
 109
109 -
 110
110 -
 111
111 -
 112
112 -
 113
113 -
 114
114 -
 115
115 -
 116
116 -
 117
117 -
 118
118 -
 119
119 -
120
-
121
-
122
-
123
-
124
-
125
-
126
-
127
-
128
-
129
-
130
 |
 |
Strategic report Governance Accounts
105
www.easyJet.com
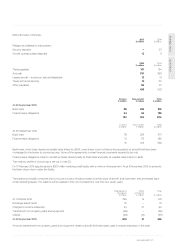
Both fuel price and exchange rates are volatile in nature, and the assumptions used represent management’s view of reasonable average
rates. Operating margins are sensitive to significant changes in these rates.
Cash flow projections beyond the forecast period have been extrapolated using growth rate scenarios ranging from zero up to an
estimated average of long-term economic growth rates for the principal countries in which easyJet operates. No impairment resulted
from any of these scenarios.
No reasonably possible combination of changes to the key assumptions above would result in the carrying value of the cash-generating
unit exceeding its recoverable amount.
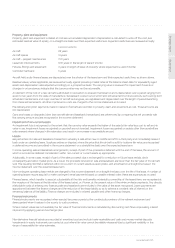
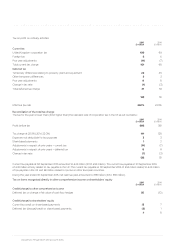
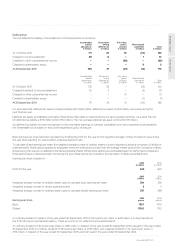
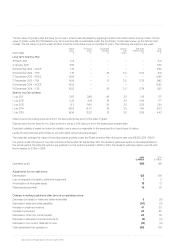
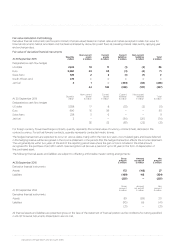
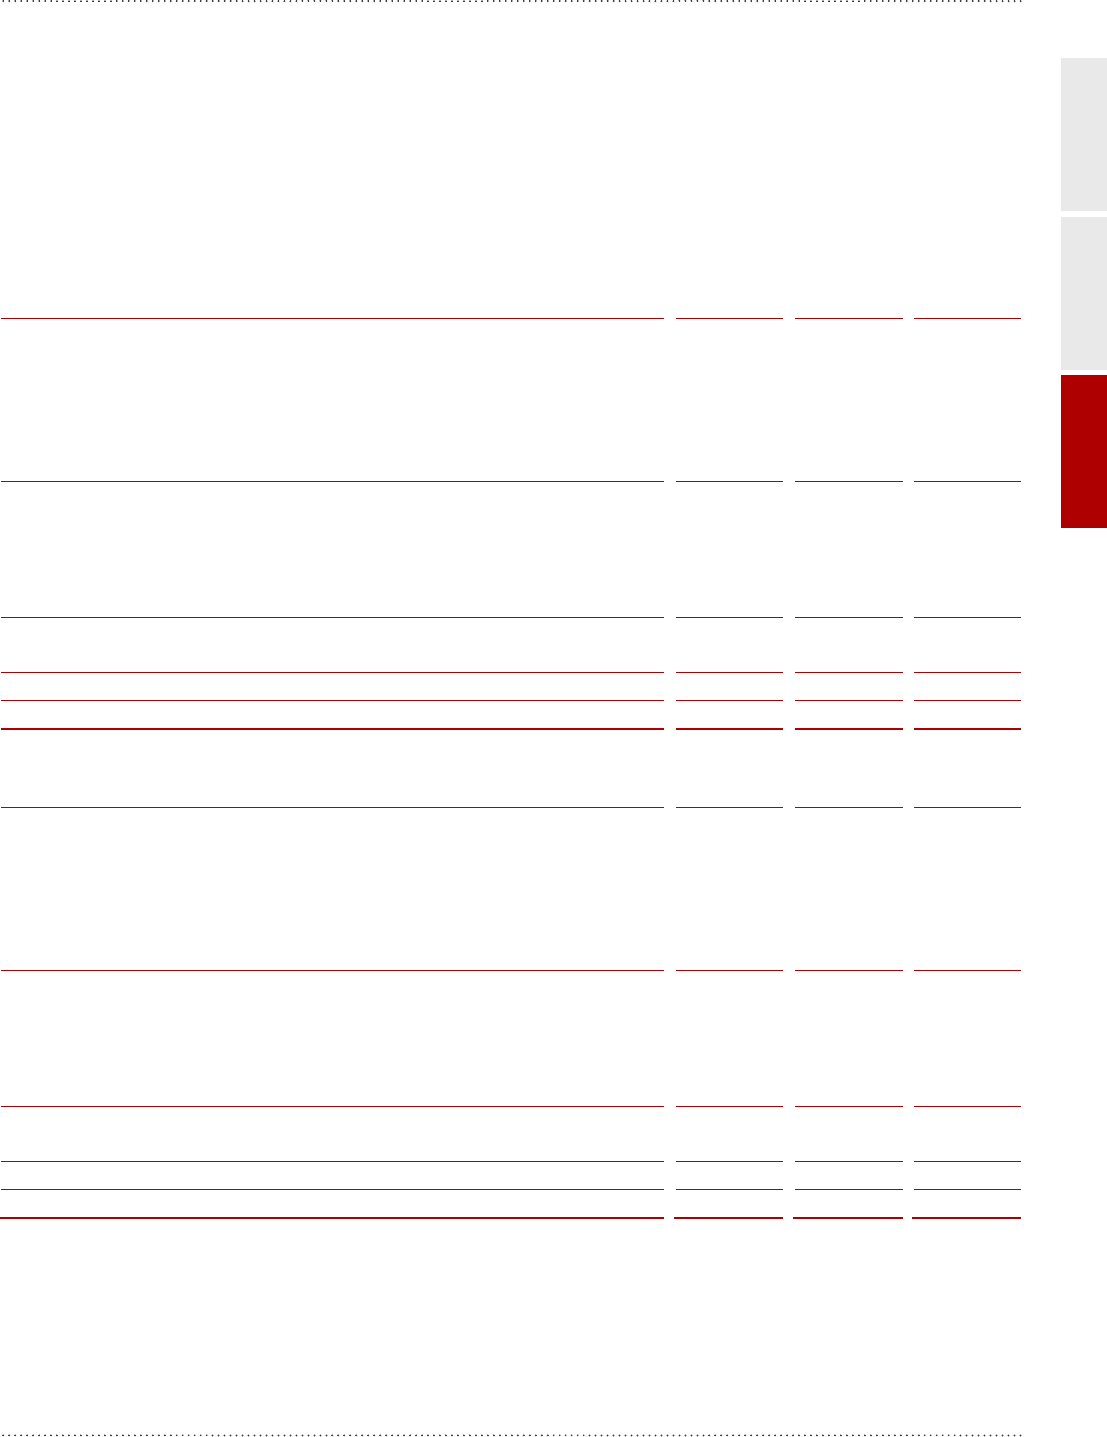
9. Property, plant and equipment
Aircraft
and spares
£ million
Other
£ million
Total
£ million
Cost
At 1 October 2014 3,035 36 3,071
Additions 500 36 536
Transfer to intangible assets – (27) (27)
Transfer to maintenance provisions (48) – (48)
Disposals (2) (2) (4)
At 30 September 2015 3,485 43 3,528
Depreciation
At 1 October 2014 517 12 529
Charge for the year 121 4 125
Disposals (2) (1) (3)
At 30 September 2015 636 15 651
Net book value
At 30 September 2015 2,849 28 2,877
At 1 October 2014 2,518 24 2,542
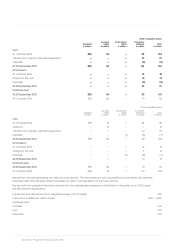
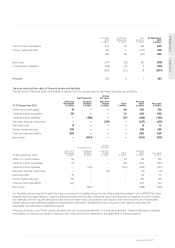
Aircraft
and spares
£ million Other
£ million
Total
£ million
Cost
At 1 October 2013 2,674 31 2,705
Additions 419 17 436
Transfer to intangible assets – (10) (10)
Transfer to maintenance provisions (55) – (55)
Disposals (3) (2) (5)
At 30 September 2014 3,035 36 3,071
Depreciation
At 1 October 2013 415 10 425
Charge for the year 103 3 106
Disposals (1) (1) (2)
At 30 September 2014 517 12 529
Net book value
At 30 September 2014 2,518 24 2,542
At 1 October 2013 2,259 21 2,280