EasyJet 2015 Annual Report Download - page 127
Download and view the complete annual report
Please find page 127 of the 2015 EasyJet annual report below. You can navigate through the pages in the report by either clicking on the pages listed below, or by using the keyword search tool below to find specific information within the annual report.-
 1
1 -
2
-
3
-
4
-
5
-
6
-
7
-
8
-
9
-
10
-
11
-
12
-
13
-
14
-
15
-
16
-
17
-
18
-
19
-
20
-
21
-
22
-
23
-
24
-
25
-
26
-
27
-
28
-
29
-
30
-
31
-
32
-
33
-
34
-
35
-
36
-
37
-
38
-
39
-
40
-
41
-
42
-
43
-
44
-
45
-
46
-
47
-
48
-
49
-
50
-
51
-
52
-
53
-
54
-
55
-
56
-
57
-
58
-
59
-
60
-
61
-
62
-
63
-
64
-
65
-
66
-
67
-
68
-
69
-
70
-
71
-
72
-
73
-
74
-
75
-
76
-
77
-
78
-
79
-
80
-
81
-
82
-
83
-
84
-
85
-
86
-
87
-
88
-
89
-
90
-
91
-
92
-
93
-
94
-
95
-
96
-
97
-
98
-
99
-
100
-
101
-
102
-
103
-
104
-
105
-
106
-
107
-
108
-
109
-
110
-
111
-
112
-
113
-
114
-
115
-
116
-
 117
117 -
 118
118 -
 119
119 -
 120
120 -
 121
121 -
 122
122 -
 123
123 -
 124
124 -
 125
125 -
 126
126 -
 127
127 -
 128
128 -
 129
129 -
 130
130
 |
 |

Strategic report Governance Accounts
123
www.easyJet.com
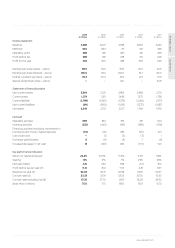
Five-year summary
2015
£ million
2014
£ million
2013
£ million
2012
£ million
2011
£ million
Income statement
Revenue 4,686 4,527 4,258 3,854 3,452
EBITDAR 940 823 711 531 468
Operating profit 688 581 497 331 269
Profit before tax 686 581 478 317 248
Profit for the year 548 450 398 255 225
Earnings per share (basic) – pence 139.1 114.5 101.3 62.5 52.5
Earnings per share (diluted) – pence 138.0 113.2 100.0 61.7 52.0
Ordinary dividend per share – pence 55.2 45.4 33.5 21.5 10.5
Special dividend per share – pence – – 44.1 – 34.9
Statement of financial position
Non-current assets 3,549 3,221 2,964 2,968 2,731
Current assets 1,279 1,261 1,448 1,327 1,738
Current liabilities (1,768) (1,420) (1,379) (1,264) (1,177)
Non-current liabilities (811) (890) (1,016) (1,237) (1,587)
Net assets 2,249 2,172 2,017 1,794 1,705
Net cash
Operating activities 609 394 616 261 424
Investing activities (532) (445) (416) (389) (478)
Financing activities (excluding movements in
borrowings and money market deposits) (70) (76) 439 (50) 201
Loan issue costs – (1) (3) (3) 1
Exchange gains/(losses) 6 (8) (4) 7 (8)
Increase/(decrease) in net cash 13 (136) 632 (174) 140
Key performance indicators
Return on capital employed 22.2% 20.5% 17.4% 11.3% 9.8%
Gearing 14% 17% 7% 29% 28%
Net cash/(debt) 435 422 558 (74) 100
Profit before tax per seat (£) 9.15 8.12 7.03 4.81 3.97
Revenue per seat (£) 62.48 63.31 62.58 58.51 55.27
Cost per seat (£) 53.33 55.19 55.55 53.70 51.30
Cost per seat excluding fuel (£) 37.35 37.70 38.17 36.25 36.62
Seats flown (millions) 75.0 71.5 68.0 65.9 62.5