EasyJet 2015 Annual Report Download - page 80
Download and view the complete annual report
Please find page 80 of the 2015 EasyJet annual report below. You can navigate through the pages in the report by either clicking on the pages listed below, or by using the keyword search tool below to find specific information within the annual report.-
 1
1 -
2
-
3
-
4
-
5
-
6
-
7
-
8
-
9
-
10
-
11
-
12
-
13
-
14
-
15
-
16
-
17
-
18
-
19
-
20
-
21
-
22
-
23
-
24
-
25
-
26
-
27
-
28
-
29
-
30
-
31
-
32
-
33
-
34
-
35
-
36
-
37
-
38
-
39
-
40
-
41
-
42
-
43
-
44
-
45
-
46
-
47
-
48
-
49
-
50
-
51
-
52
-
53
-
54
-
55
-
56
-
57
-
58
-
59
-
60
-
61
-
62
-
63
-
64
-
65
-
66
-
67
-
68
-
69
-
 70
70 -
 71
71 -
 72
72 -
 73
73 -
 74
74 -
 75
75 -
 76
76 -
 77
77 -
 78
78 -
 79
79 -
 80
80 -
 81
81 -
 82
82 -
 83
83 -
 84
84 -
 85
85 -
 86
86 -
 87
87 -
 88
88 -
 89
89 -
 90
90 -
91
-
92
-
93
-
94
-
95
-
96
-
97
-
98
-
99
-
100
-
101
-
102
-
103
-
104
-
105
-
106
-
107
-
108
-
109
-
110
-
111
-
112
-
113
-
114
-
115
-
116
-
117
-
118
-
119
-
120
-
121
-
122
-
123
-
124
-
125
-
126
-
127
-
128
-
129
-
130
 |
 |

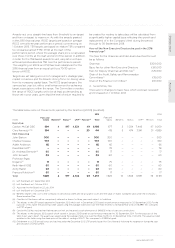
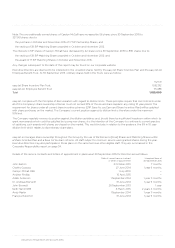
76 easyJet plc Annual report and accounts 2015
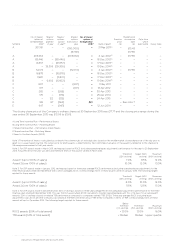
Chris Kennedy
Scheme
No. of shares/
options at
30 September
2014(1)
Shares/
options
granted
in year
Shares/
options
lapsed
in year(8)
Shares/
options
exercised in
year
No. of shares/
options at
30 September
2015(1) Date of grant
Exercise
price
(£)
Market price
on exercise
date
(£)
Date from
which
exercisable Expiry Date
A 207,161 – – (150,000) –31 Mar 2011(2) –£15.43 – –
(57,161) £17.85
A 203,664 – – (203,664) –4 Jan 2012(3) – £17.85 – –
A 83,446 – (83,446) – –18 Dec 2012(4) – – – –
A 41,857 – (41,857) – –17 Dec 2013(5) – – – –
A – 39,306 (39,306) – –19 Dec 2014(6) – – – –
B 32,174 – – (32,174) –4 Jan 2012(3) – £17.85 – –
B 16,878 – (16,878) – –18 Dec 2012(4) – – – –
B 11,801 – (11,801) – – 17 Dec 2013(5) – – – –
B – 6,402 (6,402) – –19 Dec 2014(6) – – – –
C 807 – – (807) –1 May 2011 – – – –
C 617 – – (617) –18 Apr 2012 – – – –
C 265 – (265) – –30 Apr 2013 – – – –
C 176 – (176) – –25 Apr 2014 – – – –
C – 122 (122) – –24 Apr 2015 – – – –
D 918 87 (364) – 641 – – See note 7 – –
E 947 – (947) – –12 Jun 2014 – – – –
The closing share price of the Company’s ordinary shares at 30 September 2015 was £17.77 and the closing price range during the
year ended 30 September 2015 was £13.06 to £19.15.
Key:
A Long Term Incentive Plan – Performance Shares
B Long Term Incentive Plan – Matching Shares
C Share Incentive Plan – Performance (Free) Shares
D Share Incentive Plan – Matching Shares
E Save As You Earn Awards (SAYE)
Notes:
Note 1: The number of shares is calculated according to the scheme rules of individual plans based on the middle-market closing share price of the day prior to
grant. As is usual market practice, the option price for SAYE awards is determined by the Committee in advance of the award by reference to the share price
following announcement of half year results.
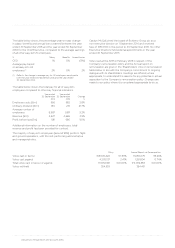
Note 2: For LTIP awards made in March 2011, vesting was based on ROCE (excluding operating leases adjustment) performance for the year to 30 September
2013. Actual ROCE for the year was 23% and therefore 100% of the awards vested in March 2014.
Threshold
(25% vesting)
Target (50%
vesting)
Maximum
(100% vesting)
Award 1 (up to 100% of salary) 7.0% 8.5% 12.0%
Award 2 (over 100% of salary) 10.0% 12.0% 13.0%
Note 3: For LTIP awards made in January 2012, vesting was based on three-year average ROCE performance (excluding operating leases adjustment) for the
three financial years ended 30 September 2014, which averaged 22.0%. Correspondingly 100% of these awards vested in January 2015. The following targets
applied for these awards:
Threshold
(25% vesting)
Target (50%
vesting)
Maximum
(100% vesting)
Award 1 (up to 100% of salary) 8.0% 10.0% 12.0%
Award 2 (over 100% of salary) 11.5% 12.5% 13.0%
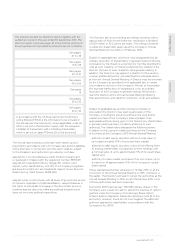
Note 4: For LTIP awards made in December 2012, 50% of vesting is based on three-year average ROCE (including lease adjustment) performance for the three
financial years ending 30 September 2015. This was the first award where ROCE calculations included operating leases and this is the basis for all subsequent
rewards. 50% of vesting is based on relative TSR performance compared to companies ranked FTSE 51-150. Three year average ROCE (including lease
adjustments) was 20.0% and the Company was ranked at the 94th percentile versus FTSE 51-150 companies in terms of TSR; correspondingly 100% of these
awards will vest in December 2015. The following targets applied for these awards:
Below
threshold
(0% vesting)
Threshold
(25% vesting)
Maximum
(100% vesting)
ROCE awards (50% of total award) < 12.0% 12.0% 16.0%
TSR awards (50% of total award) < Median Median Upper quartile
Directors’ remuneration report continued