EasyJet 2015 Annual Report Download - page 23
Download and view the complete annual report
Please find page 23 of the 2015 EasyJet annual report below. You can navigate through the pages in the report by either clicking on the pages listed below, or by using the keyword search tool below to find specific information within the annual report.-
 1
1 -
2
-
3
-
4
-
5
-
6
-
7
-
8
-
9
-
10
-
11
-
12
-
 13
13 -
 14
14 -
 15
15 -
 16
16 -
 17
17 -
 18
18 -
 19
19 -
 20
20 -
 21
21 -
 22
22 -
 23
23 -
 24
24 -
 25
25 -
 26
26 -
 27
27 -
 28
28 -
 29
29 -
 30
30 -
 31
31 -
 32
32 -
 33
33 -
34
-
35
-
36
-
37
-
38
-
39
-
40
-
41
-
42
-
43
-
44
-
45
-
46
-
47
-
48
-
49
-
50
-
51
-
52
-
53
-
54
-
55
-
56
-
57
-
58
-
59
-
60
-
61
-
62
-
63
-
64
-
65
-
66
-
67
-
68
-
69
-
70
-
71
-
72
-
73
-
74
-
75
-
76
-
77
-
78
-
79
-
80
-
81
-
82
-
83
-
84
-
85
-
86
-
87
-
88
-
89
-
90
-
91
-
92
-
93
-
94
-
95
-
96
-
97
-
98
-
99
-
100
-
101
-
102
-
103
-
104
-
105
-
106
-
107
-
108
-
109
-
110
-
111
-
112
-
113
-
114
-
115
-
116
-
117
-
118
-
119
-
120
-
121
-
122
-
123
-
124
-
125
-
126
-
127
-
128
-
129
-
130
 |
 |
Strategic report Governance Accounts
19
www.easyJet.com
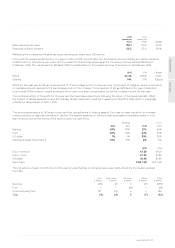
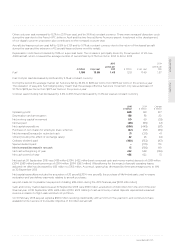
share and dividends per share
2015
pence per
share
2014
pence per
share Change
Basic earnings per share 139.1 114.5 21.5%
Proposed ordinary dividend 55.2 45.4 21.6%
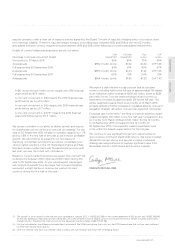
Reflecting the increased profit after tax, basic earnings per share were 139.1 pence.
In line with the stated dividend policy of a payout ratio of 40% of profit after tax, the Board is recommending an ordinary dividend
of £219 million or 55.2 pence per share, which is subject to shareholder approval at the Company’s Annual General Meeting on
11 February 2016. This will be paid on 18 March 2016 to shareholders on the register at close of business on 26 February 2016.
eturn on capital emplo e
2015 2014 Change
ROCE 22.2% 20.5% 1.7ppt
Gearing 14% 17% (3ppt)
ROCE for the year was 22.2%, an improvement of 1.7 percentage points on the prior year. The impact of hedging reserve movements
on capital employed represents 0.8 percentage points of this increase. The acquisition of 20 aircraft during the year contributed
to an overall 9.1% increase in capital employed which was more than compensated for by the increase in profit for the year.
The combined effect of the profit for the year and the lower lease adjustment following the return of five leased aircraft, offset
the impact of capital expenditure and the ordinary dividend payment, resulting in gearing of 14% (2014: 17%), which is marginally
outside the target range of 15% to 30%.
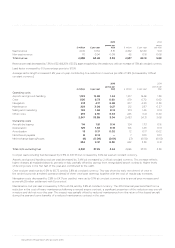
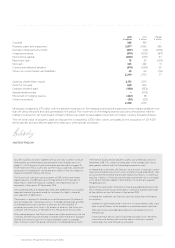
CHANGE RATES
The strong performance of UK beach routes and the strengthening of sterling against Euro year-on-year resulted in an increase
in the proportion of sales denominated in sterling. The relative weakness in the Euro was observable to a greater extent in cost
than revenues due to the timing of the revenue and cost cash flows.
Revenue Costs
2015 2014 2015 2014
Sterling 49% 47% 27% 26%
Euro 40% 42% 32% 33%
US dollar 1% 1% 35% 35%
Other (principally Swiss franc) 10% 10% 6% 6%
Average exchange rates
2015 2014
Euro – revenue €1.29 €1.21
Euro – costs €1.35 €1.22
US dollar $1.58 $1.59
Swiss franc CHF 1.48 CHF 1.49
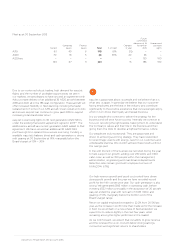
The net adverse impact on profit due to the year-on-year changes in exchange rates was mainly driven by the weaker average
Euro rate:
Favourable/(adverse)
Euro
£ million
Swiss franc
£ million
US dollar
£ million
Other
£ million
Total
£ million
Revenue (131) (1) 4 (7) (135)
Fuel – – (6) – (6)
Costs excluding fuel 127 (3) 5 – 129
Total (4) (4) 3 (7) (12)