EasyJet 2015 Annual Report Download - page 115
Download and view the complete annual report
Please find page 115 of the 2015 EasyJet annual report below. You can navigate through the pages in the report by either clicking on the pages listed below, or by using the keyword search tool below to find specific information within the annual report.-
 1
1 -
2
-
3
-
4
-
5
-
6
-
7
-
8
-
9
-
10
-
11
-
12
-
13
-
14
-
15
-
16
-
17
-
18
-
19
-
20
-
21
-
22
-
23
-
24
-
25
-
26
-
27
-
28
-
29
-
30
-
31
-
32
-
33
-
34
-
35
-
36
-
37
-
38
-
39
-
40
-
41
-
42
-
43
-
44
-
45
-
46
-
47
-
48
-
49
-
50
-
51
-
52
-
53
-
54
-
55
-
56
-
57
-
58
-
59
-
60
-
61
-
62
-
63
-
64
-
65
-
66
-
67
-
68
-
69
-
70
-
71
-
72
-
73
-
74
-
75
-
76
-
77
-
78
-
79
-
80
-
81
-
82
-
83
-
84
-
85
-
86
-
87
-
88
-
89
-
90
-
91
-
92
-
93
-
94
-
95
-
96
-
97
-
98
-
99
-
100
-
101
-
102
-
103
-
104
-
 105
105 -
 106
106 -
 107
107 -
 108
108 -
 109
109 -
 110
110 -
 111
111 -
 112
112 -
 113
113 -
 114
114 -
 115
115 -
 116
116 -
 117
117 -
 118
118 -
 119
119 -
 120
120 -
 121
121 -
 122
122 -
 123
123 -
 124
124 -
 125
125 -
126
-
127
-
128
-
129
-
130
 |
 |
Strategic report Governance Accounts
111
www.easyJet.com
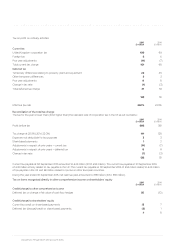
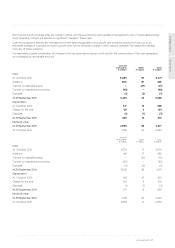
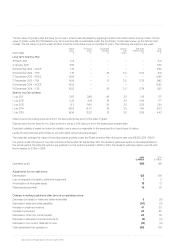
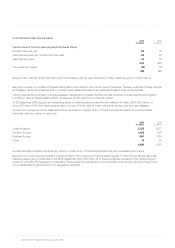
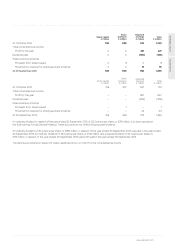
20. Reconciliation of net cash flow to movement in net cash
1 October
2014
£ million
Exchange
differences
£ million
Net
cash flow
£ million
30 September
2015
£ million
Cash and cash equivalents 424 33 193 650
Money market deposits 561 5 (277) 289
985 38 (84) 939
Bank loans (377) (19) 80 (316)
Finance lease obligations (186) (13) 11 (188)
(563) (32) 91 (504)
Net cash 422 6 7 435
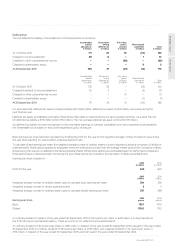
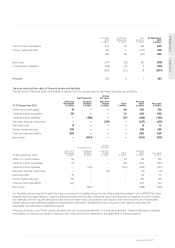
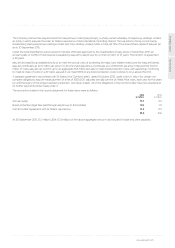
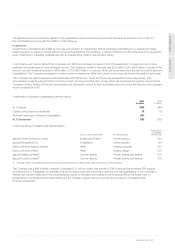
21. Financial instruments
Carrying value and fair value of financial assets and liabilities
The fair values of financial assets and liabilities, together with the carrying value at each reporting date, are as follows:
Amortised cost
Held at
fair value
At 30 September 2015
Loans and
receivables
£ million
Financial
liabilities
£ million
Cash flow
hedges
£ million
Other
£ million
Carrying
value
£ million
Fair value
£ million
Other non-current assets 91 – – 39 130 130
Trade and other receivables 136 – – 70 206 206
Trade and other payables – (398) – (97) (495) (495)
Derivative financial instruments – – (297) – (297) (297)
Restricted cash 12 – – – 12 12
Money market deposits 289 – – – 289 289
Cash and cash equivalents 650 – – – 650 650
Borrowings – (504) – – (504) (510)
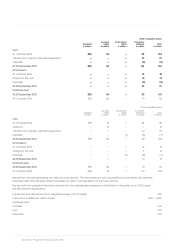
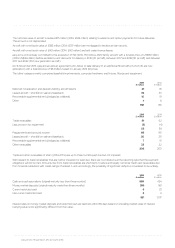
Amortised cost
Held at
fair value
At 30 September 2014
Loans and
receivables
£ million
Financial
liabilities
£ million
Cash flow
hedges
£ million
Other
£ million
Carrying
value
£ million
Fair value
£ million
Other non-current assets 99 – – 57 156 156
Trade and other receivables 112 – – 88 200 200
Trade and other payables – (419) – (104) (523) (523)
Derivative financial instruments – – (21) – (21) (21)
Restricted cash 32 – – – 32 32
Money market deposits 561 – – – 561 561
Cash and cash equivalents 424 – – – 424 424
Borrowings – (563) – – (563) (568)
For the financial instruments for which fair value is disclosed in the tables above, the fair value is classified as level 2 of the IFRS13 ‘Fair Value
Measurement’ fair value hierarchy. Level 2 is defined as being the fair value of financial instruments that are not traded in an active market
(for example, over-the-counter derivatives) and which are determined using valuation techniques which maximise the use of observable
market data and rely as little as possible on entity-specific estimates. If all significant inputs required to fair value an instrument are
observable, the instrument is classified as level 2.
Amounts disclosed in the ‘Other’ column are items that do not meet the definition of a financial instrument. They are disclosed to facilitate
reconciliation of the carrying values of financial instruments to line items presented in the statement of financial position.