EasyJet 2015 Annual Report Download - page 14
Download and view the complete annual report
Please find page 14 of the 2015 EasyJet annual report below. You can navigate through the pages in the report by either clicking on the pages listed below, or by using the keyword search tool below to find specific information within the annual report.-
 1
1 -
2
-
3
-
 4
4 -
 5
5 -
 6
6 -
 7
7 -
 8
8 -
 9
9 -
 10
10 -
 11
11 -
 12
12 -
 13
13 -
 14
14 -
 15
15 -
 16
16 -
 17
17 -
 18
18 -
 19
19 -
 20
20 -
 21
21 -
 22
22 -
 23
23 -
 24
24 -
25
-
26
-
27
-
28
-
29
-
30
-
31
-
32
-
33
-
34
-
35
-
36
-
37
-
38
-
39
-
40
-
41
-
42
-
43
-
44
-
45
-
46
-
47
-
48
-
49
-
50
-
51
-
52
-
53
-
54
-
55
-
56
-
57
-
58
-
59
-
60
-
61
-
62
-
63
-
64
-
65
-
66
-
67
-
68
-
69
-
70
-
71
-
72
-
73
-
74
-
75
-
76
-
77
-
78
-
79
-
80
-
81
-
82
-
83
-
84
-
85
-
86
-
87
-
88
-
89
-
90
-
91
-
92
-
93
-
94
-
95
-
96
-
97
-
98
-
99
-
100
-
101
-
102
-
103
-
104
-
105
-
106
-
107
-
108
-
109
-
110
-
111
-
112
-
113
-
114
-
115
-
116
-
117
-
118
-
119
-
120
-
121
-
122
-
123
-
124
-
125
-
126
-
127
-
128
-
129
-
130
 |
 |

10 easyJet plc Annual report and accounts 2015
Chief Executive’s review continued
EXTERNAL ENVIRONMENT
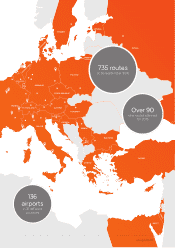
easyJet operates in the short-haul European aviation market,
which has seen strong underlying demand throughout the year.
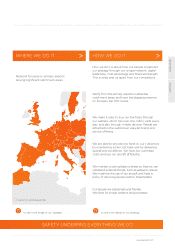
easyJet’s focus is primarily in Western and Northern Europe,
where there is a high propensity to travel and deep, rich markets.
Economic trends are currently favourable, with GDP growth in
our main markets. The UK is the strongest country in terms
of absolute GDP performance in 2015 and we continue to see
an improving outlook across all of our other major regions. In
addition, consumer confidence is growing in those markets,
which we expect to support growth in economic activity.
These positive trends, combined with our market positioning,
are reflected in strong demand for our services.
The total European short-haul market(2) grew by 5% year-on-year
in the 12 months to 30 September 2015, sustained in part by a
continued low fuel price. Low cost carrier share of the short-haul
market increased by around one percentage point to 42%. In the
same period, easyJet’s competitors increased capacity by 7%
in its markets, with particularly strong growth in the UK market.
Over its financial year, easyJet increased capacity by 5%, with
growth of 4% in the first half increasing to 6% in the second half.
Whilst the overall short-haul market has grown over the last 10
years, the low-cost carriers have taken significant market share,
as the legacy carriers have cut mainline capacity across their
networks in order to address their lack of competitiveness.
At the same time the legacy carriers are transferring capacity
from their flag airlines to lower-cost subsidiaries such as Vueling,
Eurowings and Transavia. In its 20 years of existence, easyJet has
grown its own market share as part of that low cost growth and
now has an estimated 8% of the European short-haul market.
We see a number of opportunities to increase our market share.
easyJet has delivered a strong performance against this
competitive backdrop, demonstrating the strength of its model
and implementation of its strategy. With a track record of high
growth across economic cycles, strong underlying demand,
as well as our relatively low current market share, we continue to
see opportunities to deliver further growth over the medium term.
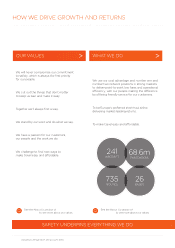
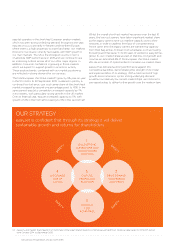
Our strategy
1.
BUILD STRONG
NUMBER ONE AND
TWO NETWORK
POSITIONS
5.
CULTURE,
PEOPLE AND
PLATFORM
2.
DRIVE DEMAND,
CONVERSION
AND YIELDS
4.
DISCIPLINED
USE OF
CAPITAL
3.
MAINTAIN
COST
ADVANTAGE
S
A
F
E
T
Y
S
A
F
E
T
Y
S
A
F
E
T
Y
S
A
F
E
T
Y
easyJet is confident that through its strategy it will deliver
sustainable growth and returns for shareholders.
(2) Capacity and market share figures from OAG. Size of European market based on internal easyJet definition. Historical data based on 12 month period
from October 2014 to September 2015.