EasyJet 2015 Annual Report Download - page 24
Download and view the complete annual report
Please find page 24 of the 2015 EasyJet annual report below. You can navigate through the pages in the report by either clicking on the pages listed below, or by using the keyword search tool below to find specific information within the annual report.-
 1
1 -
2
-
3
-
4
-
5
-
6
-
7
-
8
-
9
-
10
-
11
-
12
-
13
-
 14
14 -
 15
15 -
 16
16 -
 17
17 -
 18
18 -
 19
19 -
 20
20 -
 21
21 -
 22
22 -
 23
23 -
 24
24 -
 25
25 -
 26
26 -
 27
27 -
 28
28 -
 29
29 -
 30
30 -
 31
31 -
 32
32 -
 33
33 -
 34
34 -
35
-
36
-
37
-
38
-
39
-
40
-
41
-
42
-
43
-
44
-
45
-
46
-
47
-
48
-
49
-
50
-
51
-
52
-
53
-
54
-
55
-
56
-
57
-
58
-
59
-
60
-
61
-
62
-
63
-
64
-
65
-
66
-
67
-
68
-
69
-
70
-
71
-
72
-
73
-
74
-
75
-
76
-
77
-
78
-
79
-
80
-
81
-
82
-
83
-
84
-
85
-
86
-
87
-
88
-
89
-
90
-
91
-
92
-
93
-
94
-
95
-
96
-
97
-
98
-
99
-
100
-
101
-
102
-
103
-
104
-
105
-
106
-
107
-
108
-
109
-
110
-
111
-
112
-
113
-
114
-
115
-
116
-
117
-
118
-
119
-
120
-
121
-
122
-
123
-
124
-
125
-
126
-
127
-
128
-
129
-
130
 |
 |

20 easyJet plc Annual report and accounts 2015
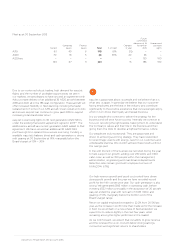
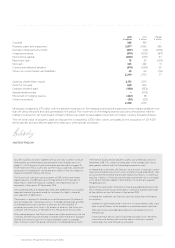
Financial review continued
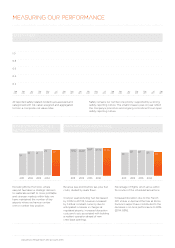
FINANCIAL PERFORMANCE
Revenue
2015 2014
£ million £ per seat
pence per
ASK £ million £ per seat
pence
per ASK
Seat revenue 4,616 61.54 5.51 4,462 62.40 5.61
Non-seat revenue 70 0.94 0.08 65 0.91 0.08
Total revenue 4,686 62.48 5.59 4,527 63.31 5.69
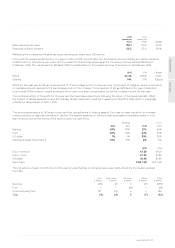
Revenue per seat decreased by 1.3% to £62.48 (2014: £63.31), again impacted by the weak euro, with an increase of 1.5% at constant currency.
Load factor increased by 0.9 percentage points to 91.5%.
Average sector length increased 0.5% year-on-year contributing to a reduction in revenue per ASK of 1.8% (increased by 1.0% at
constant currency).
Costs excluding fuel
2015 2014
£ million £ per seat
pence per
ASK £ million £ per seat
pence per
ASK
Operating costs
Airports and ground handling 1,122 14.96 1.34 1,107 15.48 1.39
Crew 505 6.73 0.60 479 6.70 0.60
Navigation 313 4.17 0.38 307 4.30 0.39
Maintenance 229 3.06 0.27 212 2.97 0.27
Selling and marketing 102 1.36 0.12 103 1.45 0.13
Other costs 276 3.70 0.33 245 3.41 0.30
2,547 33.98 3.04 2,453 34.31 3.08
Ownership costs
Aircraft dry leasing 114 1.51 0.14 124 1.73 0.16
Depreciation 125 1.66 0.15 106 1.49 0.13
Amortisation 13 0.17 0.02 12 0.17 0.02
Net interest payable 8 0.12 – 7 0.10 0.01
Net exchange (gains)/losses (6) (0.09) (0.01) (7) (0.10) (0.01)
254 3.37 0.30 242 3.39 0.31
Total costs excluding fuel 2,801 37.35 3.34 2,695 37.70 3.39
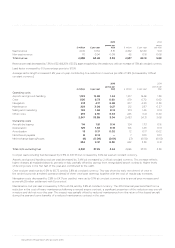
Cost per seat excluding fuel decreased by 0.9% to £37.35 but increased by 3.6% per seat at constant currency.
Airports and ground handling cost per seat decreased by 3.4% but increased by 2.4% at constant currency. This increase reflects
higher charges at regulated airports, primarily in Italy, partially offset by savings from renegotiated airport contracts. Higher levels
of de-icing costs in the first half of the year also contributed to the uplift.
Crew cost per seat rose by 0.6% to £6.73, and by 3.8% at constant currency. This was driven by early recruitment of crew in
the winter to provide a resilient operation ahead of three crew base openings together with the cost of regular pay increases.
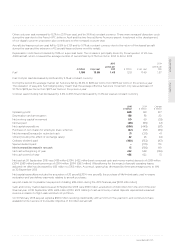
Navigation costs decreased by 2.8% to £4.17 per seat but were up by 5.1% at constant currency due to annual price increases and
a one-off £8 million settlement with Eurocontrol.
Maintenance cost per seat increased by 3.1% to £3.06, and by 3.8% at constant currency. The 2014 financial year benefited from a
reduction in the cost of heavy maintenance following a revised engine contract, a significant proportion of this reduction was one-off
in nature and did not recur this year. This impact was partially offset by reduced maintenance from the return of five leased aircraft
during the year and some benefits of a reduced maintenance contract in the year.