BMW 2015 Annual Report Download - page 95
Download and view the complete annual report
Please find page 95 of the 2015 BMW annual report below. You can navigate through the pages in the report by either clicking on the pages listed below, or by using the keyword search tool below to find specific information within the annual report.-
 1
1 -
2
-
3
-
4
-
5
-
6
-
7
-
8
-
9
-
10
-
11
-
12
-
13
-
14
-
15
-
16
-
17
-
18
-
19
-
20
-
21
-
22
-
23
-
24
-
25
-
26
-
27
-
28
-
29
-
30
-
31
-
32
-
33
-
34
-
35
-
36
-
37
-
38
-
39
-
40
-
41
-
42
-
43
-
44
-
45
-
46
-
47
-
48
-
49
-
50
-
51
-
52
-
53
-
54
-
55
-
56
-
57
-
58
-
59
-
60
-
61
-
62
-
63
-
64
-
65
-
66
-
67
-
68
-
69
-
70
-
71
-
72
-
73
-
74
-
75
-
76
-
77
-
78
-
79
-
80
-
81
-
82
-
83
-
84
-
 85
85 -
 86
86 -
 87
87 -
 88
88 -
 89
89 -
 90
90 -
 91
91 -
 92
92 -
 93
93 -
 94
94 -
 95
95 -
 96
96 -
 97
97 -
 98
98 -
 99
99 -
 100
100 -
 101
101 -
 102
102 -
 103
103 -
 104
104 -
 105
105 -
106
-
107
-
108
-
109
-
110
-
111
-
112
-
113
-
114
-
115
-
116
-
117
-
118
-
119
-
120
-
121
-
122
-
123
-
124
-
125
-
126
-
127
-
128
-
129
-
130
-
131
-
132
-
133
-
134
-
135
-
136
-
137
-
138
-
139
-
140
-
141
-
142
-
143
-
144
-
145
-
146
-
147
-
148
-
149
-
150
-
151
-
152
-
153
-
154
-
155
-
156
-
157
-
158
-
159
-
160
-
161
-
162
-
163
-
164
-
165
-
166
-
167
-
168
-
169
-
170
-
171
-
172
-
173
-
174
-
175
-
176
-
177
-
178
-
179
-
180
-
181
-
182
-
183
-
184
-
185
-
186
-
187
-
188
-
189
-
190
-
191
-
192
-
193
-
194
-
195
-
196
-
197
-
198
-
199
-
200
-
201
-
202
-
203
-
204
-
205
-
206
-
207
-
208
-
209
-
210
 |
 |

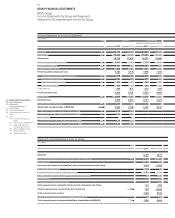
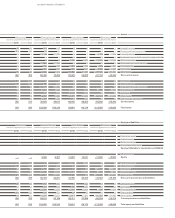
95 GROUP FINANCIAL STATEMENTS
Automotive Financial Services
(unaudited supplementary information) (unaudited supplementary information)
2015 2014 2015 2014
5,147 4,521 1,447 1,198 Net profit
Reconciliation between net profit and cash inflow / outflow from operating activities
2,893 2,786 – 125 – 40 Current tax
302 159 1 2 242 Other interest and similar income / expenses
4,577 4,230 31 29 Depreciation and amortisation of other tangible, intangible and investment assets
128 1,034 172 109 Change in provisions
3 15 – 4,026 – 3,309 Change in leased products
– – – 6,637 – 3,898 Change in receivables from sales financing
– 369 – 124 579 383 Change in deferred taxes
316 – 5 5 14 Other non-cash income and expense items
– 138 – 54 – 5 8 Gain / loss on disposal of tangible and intangible assets and marketable securities
– 518 – 655 – – Result from equity accounted investments
– 337 – 552 46 70 Changes in working capital
367 – 907 1 – Change in inventories
– 541 371 – 15 14 Change in trade receivables
– 163 – 16 60 56 Change in trade payables
2,295 419 – 1,706 858 Change in other operating assets and liabilities
– 2,595 – 2,531 – 133 – 161 Income taxes paid
132 180 –
2 –
2 Interest received
11,836 9,423 – 10,351 – 4,715 Cash inflow / outflow from operating activities
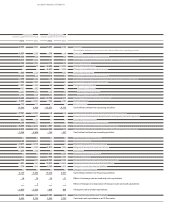
– 5,791 – 6,021 – 6 – 9 Investment in intangible assets and property, plant and equipment
38 36 – – Proceeds from the disposal of intangible assets and property, plant and equipment
– 823 – 134 – – Expenditure for investments
144 177 – – Proceeds from the disposal of investments
– 6,498 – 3,775 – 387 – 458 Investments in marketable securities and term deposits
5,406 3,881 253 170 Proceeds from the sale of marketable securities and from matured term deposits
– 7,524 – 5,836 – 140 – 297 Cash inflow / outflow from investing activities
– – – – Issue / buy-back of treasury shares
23 15 – – Payments into equity
– 1,917 – 1,715 – – Payment of dividend for the previous year
– 2,840 – 4,299 5,913 4,094 Intragroup financing and equity transactions
– 264 – 136 –
2 –
2 Interest paid
– – 429 1,009 Proceeds from the issue of bonds
– – – 773 – 733 Repayment of bonds
108 452 8,787 5,298 Proceeds from new non-current other financial liabilities
– 521 – 41 – 7,671 – 4,814 Repayment of non-current other financial liabilities
– 719 1,042 3,343 1,073 Change in current other financial liabilities
– – – – Change in commercial paper
– 6,130 – 4,682 10,028 5,927 Cash inflow / outf low from financing activities
18 70 39 – 11 Effect of exchange rate on cash and cash equivalents
– 2 – – Effect of changes in composition of Group on cash and cash equivalents
– 1,800 – 1,023 – 424 904 Change in cash and cash equivalents
5,752 6,775 1,783 879 Cash and cash equivalents as at 1 January
3,952 5,752 1,359 1,783 Cash and cash equivalents as at 31 December