BMW 2015 Annual Report Download - page 94
Download and view the complete annual report
Please find page 94 of the 2015 BMW annual report below. You can navigate through the pages in the report by either clicking on the pages listed below, or by using the keyword search tool below to find specific information within the annual report.-
 1
1 -
2
-
3
-
4
-
5
-
6
-
7
-
8
-
9
-
10
-
11
-
12
-
13
-
14
-
15
-
16
-
17
-
18
-
19
-
20
-
21
-
22
-
23
-
24
-
25
-
26
-
27
-
28
-
29
-
30
-
31
-
32
-
33
-
34
-
35
-
36
-
37
-
38
-
39
-
40
-
41
-
42
-
43
-
44
-
45
-
46
-
47
-
48
-
49
-
50
-
51
-
52
-
53
-
54
-
55
-
56
-
57
-
58
-
59
-
60
-
61
-
62
-
63
-
64
-
65
-
66
-
67
-
68
-
69
-
70
-
71
-
72
-
73
-
74
-
75
-
76
-
77
-
78
-
79
-
80
-
81
-
82
-
83
-
 84
84 -
 85
85 -
 86
86 -
 87
87 -
 88
88 -
 89
89 -
 90
90 -
 91
91 -
 92
92 -
 93
93 -
 94
94 -
 95
95 -
 96
96 -
 97
97 -
 98
98 -
 99
99 -
 100
100 -
 101
101 -
 102
102 -
 103
103 -
 104
104 -
105
-
106
-
107
-
108
-
109
-
110
-
111
-
112
-
113
-
114
-
115
-
116
-
117
-
118
-
119
-
120
-
121
-
122
-
123
-
124
-
125
-
126
-
127
-
128
-
129
-
130
-
131
-
132
-
133
-
134
-
135
-
136
-
137
-
138
-
139
-
140
-
141
-
142
-
143
-
144
-
145
-
146
-
147
-
148
-
149
-
150
-
151
-
152
-
153
-
154
-
155
-
156
-
157
-
158
-
159
-
160
-
161
-
162
-
163
-
164
-
165
-
166
-
167
-
168
-
169
-
170
-
171
-
172
-
173
-
174
-
175
-
176
-
177
-
178
-
179
-
180
-
181
-
182
-
183
-
184
-
185
-
186
-
187
-
188
-
189
-
190
-
191
-
192
-
193
-
194
-
195
-
196
-
197
-
198
-
199
-
200
-
201
-
202
-
203
-
204
-
205
-
206
-
207
-
208
-
209
-
210
 |
 |

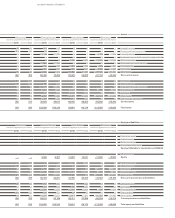
94
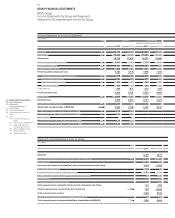
BMW Group
Cash Flow Statements for Group and Segments
Note Group
in € million 2015 2014
Net profit 6,396 5,817
Reconciliation between net profit and cash inflow / outflow from operating activities
Current tax 2,751 2,774
Other interest and similar income / expenses 239 127
Depreciation and amortisation of other tangible, intangible and investment assets 4,686 4,323
Change in provisions 296 1,103
Change in leased products – 3,299 – 2,720
Change in receivables from sales financing – 6,637 – 3,898
Change in deferred taxes 77 116
Other non-cash income and expense items 47 331
Gain / loss on disposal of tangible and intangible assets and marketable securities – 144 – 63
Result from equity accounted investments – 518 – 655
Changes in working capital – 293 – 551
Change in inventories 298 – 971
Change in trade receivables – 566 379
Change in trade payables – 25 41
Change in other operating assets and liabilities 550 323
Income taxes paid – 3,323 – 4,252
Interest received 132 137
Cash inflow / outflow from operating activities 43 960 2,912
Investment in intangible assets and property, plant and equipment – 5,889 – 6,099
Proceeds from the disposal of intangible assets and property, plant and equipment 38 36
Expenditure for investments – 7461 – 99
Proceeds from the disposal of investments 215 190
Investments in marketable securities and term deposits – 6,880 – 4,216
Proceeds from the sale of marketable securities and from matured term deposits 5,659 4,072
Cash inflow / outflow from investing activities 43 – 7,603 – 6,116
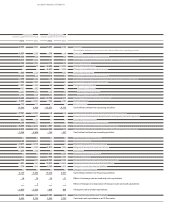
Issue / buy-back of treasury shares – –
Payments into equity 23 15
Payment of dividend for the previous year – 1,917 – 1,715
Intragroup financing and equity transactions – –
Interest paid – 264 – 133
Proceeds from the issue of bonds 13,007 10,892
Repayment of bonds – 8,908 – 7,249
Proceeds from new non-current other financial liabilities 9,715 5,900
Repayment of non-current other financial liabilities – 8,802 – 5,697
Change in current other financial liabilities 2,648 2,132
Change in commercial paper – 498 – 1,012
Cash inflow / outflow from financing activities 43 5,004 3,133
Effect of exchange rate on cash and cash equivalents 73 86
Effect of changes in composition of Group on cash and cash equivalents – 2
Change in cash and cash equivalents 43 – 1,566 17
Cash and cash equivalents as at 1 January 7,688 7,671
Cash and cash equivalents as at 31 December 6,122 7,688
1 Expenditure for investments includes the acquisition of shares in THERE Holding B. V., Amsterdam, amounting to € 668 million.
2 Interest relating to financial services business is classified as revenues / cost of sales.
90 GROUP FINANCIAL STATEMENTS
90 Income Statements
90 Statement of
Comprehensive Income
92 Balance Sheets
94 Cash Flow Statements
96 Group Statement of Changes in
Equity
98 Notes
98 Accounting Principles and
Policies
113 Notes to the Income Statement
121 Notes to the Statement
of Comprehensive Income
122
Notes to the Balance Sheet
147 Other Disclosures
163 Segment Information