BMW 2015 Annual Report Download - page 116
Download and view the complete annual report
Please find page 116 of the 2015 BMW annual report below. You can navigate through the pages in the report by either clicking on the pages listed below, or by using the keyword search tool below to find specific information within the annual report.-
 1
1 -
2
-
3
-
4
-
5
-
6
-
7
-
8
-
9
-
10
-
11
-
12
-
13
-
14
-
15
-
16
-
17
-
18
-
19
-
20
-
21
-
22
-
23
-
24
-
25
-
26
-
27
-
28
-
29
-
30
-
31
-
32
-
33
-
34
-
35
-
36
-
37
-
38
-
39
-
40
-
41
-
42
-
43
-
44
-
45
-
46
-
47
-
48
-
49
-
50
-
51
-
52
-
53
-
54
-
55
-
56
-
57
-
58
-
59
-
60
-
61
-
62
-
63
-
64
-
65
-
66
-
67
-
68
-
69
-
70
-
71
-
72
-
73
-
74
-
75
-
76
-
77
-
78
-
79
-
80
-
81
-
82
-
83
-
84
-
85
-
86
-
87
-
88
-
89
-
90
-
91
-
92
-
93
-
94
-
95
-
96
-
97
-
98
-
99
-
100
-
101
-
102
-
103
-
104
-
105
-
 106
106 -
 107
107 -
 108
108 -
 109
109 -
 110
110 -
 111
111 -
 112
112 -
 113
113 -
 114
114 -
 115
115 -
 116
116 -
 117
117 -
 118
118 -
 119
119 -
 120
120 -
 121
121 -
 122
122 -
 123
123 -
 124
124 -
 125
125 -
 126
126 -
127
-
128
-
129
-
130
-
131
-
132
-
133
-
134
-
135
-
136
-
137
-
138
-
139
-
140
-
141
-
142
-
143
-
144
-
145
-
146
-
147
-
148
-
149
-
150
-
151
-
152
-
153
-
154
-
155
-
156
-
157
-
158
-
159
-
160
-
161
-
162
-
163
-
164
-
165
-
166
-
167
-
168
-
169
-
170
-
171
-
172
-
173
-
174
-
175
-
176
-
177
-
178
-
179
-
180
-
181
-
182
-
183
-
184
-
185
-
186
-
187
-
188
-
189
-
190
-
191
-
192
-
193
-
194
-
195
-
196
-
197
-
198
-
199
-
200
-
201
-
202
-
203
-
204
-
205
-
206
-
207
-
208
-
209
-
210
 |
 |

116
Tax increases as a result of non-deductible expenses
and tax reductions due to tax-exempt income
de-
creased significantly compared to one year earlier. As
in the previous year, tax increases as a result of non-
tax-deductible expenses were attributable primarily to
the impact of non-recoverable withholding taxes and
transfer price issues.
(2014: 30.7 %),
applicable for German companies, was
applied across the Group.
The line “Other variances” comprises primarily recon-
ciling
items relating to the Group’s share of results of
equity accounted investments.
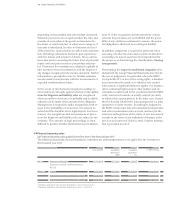
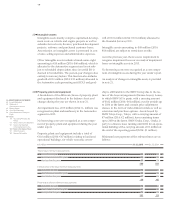
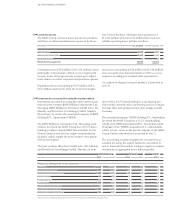
The allocation of deferred tax assets and liabilities to
balance sheet line items at 31 December is shown in the
following table:
The difference between the expected and actual tax ex-
pense is explained in the following reconciliation:
Deferred tax assets Deferred tax liabilities
in € million 2015 2014 2015 2014
Intangible assets 10 11 1,977 1,706
Property, plant and equipment 20 50 376 400
Leased products 367 393 6,260 5,486
Other investments 5 5 11 12
Other assets 1,363 1,289 2,109 2,687
Tax loss carryforwards 548 566 – –
Provisions 4,187 4,175 178 95
Liabilities 2,654 2,827 478 602
Eliminations 3,281 2,945 715 690
12,435 12,261 12,104 11,678
Valuation allowance – 502 – 496 – –
Netting – 9,988 – 9,704 – 9,988 – 9,704
Deferred taxes 1,945 2,061 2,116 1,974
Net 87 171
in € million 2015 2014
Profit before tax 9,224 8,707
Tax rate applicable in Germany 30.7 % 30.7 %
Expected tax expense 2,832 2,673
Variances due to different tax rates – 119 – 55
Tax increases (+) / tax reductions (–) as a result of non-deductible expenses and tax-exempt income 42 150
Tax expense (+) / benefits (–) for prior years 164 275
Other variances – 91 – 153
Actual tax expense 2,828 2,890
Effective tax rate 30.7 % 33.2 %
90 GROUP FINANCIAL STATEMENTS
90 Income Statements
90 Statement of
Comprehensive Income
92 Balance Sheets
94 Cash Flow Statements
96 Group Statement of Changes in
Equity
98 Notes
98 Accounting Principles and
Policies
113 Notes to the Income Statement
121 Notes to the Statement
of Comprehensive Income
122
Notes to the Balance Sheet
147 Other Disclosures
163 Segment Information