BMW 2015 Annual Report Download - page 135
Download and view the complete annual report
Please find page 135 of the 2015 BMW annual report below. You can navigate through the pages in the report by either clicking on the pages listed below, or by using the keyword search tool below to find specific information within the annual report.-
 1
1 -
2
-
3
-
4
-
5
-
6
-
7
-
8
-
9
-
10
-
11
-
12
-
13
-
14
-
15
-
16
-
17
-
18
-
19
-
20
-
21
-
22
-
23
-
24
-
25
-
26
-
27
-
28
-
29
-
30
-
31
-
32
-
33
-
34
-
35
-
36
-
37
-
38
-
39
-
40
-
41
-
42
-
43
-
44
-
45
-
46
-
47
-
48
-
49
-
50
-
51
-
52
-
53
-
54
-
55
-
56
-
57
-
58
-
59
-
60
-
61
-
62
-
63
-
64
-
65
-
66
-
67
-
68
-
69
-
70
-
71
-
72
-
73
-
74
-
75
-
76
-
77
-
78
-
79
-
80
-
81
-
82
-
83
-
84
-
85
-
86
-
87
-
88
-
89
-
90
-
91
-
92
-
93
-
94
-
95
-
96
-
97
-
98
-
99
-
100
-
101
-
102
-
103
-
104
-
105
-
106
-
107
-
108
-
109
-
110
-
111
-
112
-
113
-
114
-
115
-
116
-
117
-
118
-
119
-
120
-
121
-
122
-
123
-
124
-
 125
125 -
 126
126 -
 127
127 -
 128
128 -
 129
129 -
 130
130 -
 131
131 -
 132
132 -
 133
133 -
 134
134 -
 135
135 -
 136
136 -
 137
137 -
 138
138 -
 139
139 -
 140
140 -
 141
141 -
 142
142 -
 143
143 -
 144
144 -
 145
145 -
146
-
147
-
148
-
149
-
150
-
151
-
152
-
153
-
154
-
155
-
156
-
157
-
158
-
159
-
160
-
161
-
162
-
163
-
164
-
165
-
166
-
167
-
168
-
169
-
170
-
171
-
172
-
173
-
174
-
175
-
176
-
177
-
178
-
179
-
180
-
181
-
182
-
183
-
184
-
185
-
186
-
187
-
188
-
189
-
190
-
191
-
192
-
193
-
194
-
195
-
196
-
197
-
198
-
199
-
200
-
201
-
202
-
203
-
204
-
205
-
206
-
207
-
208
-
209
-
210
 |
 |

135 GROUP FINANCIAL STATEMENTS
income” and hence directly in equity (within revenue
reserves).
Past service cost arises where a BMW Group entity in-
troduces a defined benefit plan or changes the benefits
payable under an existing plan. These costs are
recog-
nised immediately in the income statement. Similarly,
gains and losses arising on the settlement of a defined
benefit plan are recognised immediately in the income
statement.
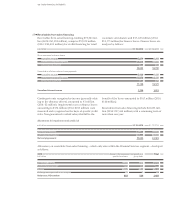
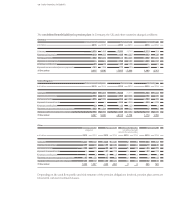
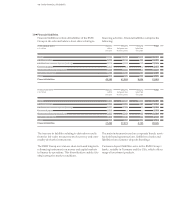
The defined benefit obligation is calculated on an ac-
tuarial basis. The actuarial computation requires the
use of estimates and assumptions, which depend on the
economic situation in each particular country. The most
important assumptions applied by the BMW Group are
shown below. The following weighted average values
have been used for Germany, the United Kingdom and
other countries:
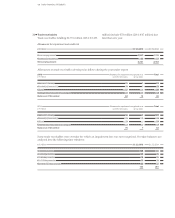
31 December Germany United Kingdom Other
in % 2015 2014 2015 2014 2015 2014
Discount rate 2.51 2.10 3.58 3.40 3.83 3.48
Pension level trend 1.60 1.60 2.43 2.43 0.02 0.03
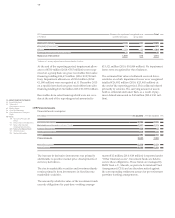
In Germany, the so-called “pension entitlement trend”
(Festbetragstrend) also represents a significant actuarial
assumption for the purposes of determining benefits
payable at retirement and was left unchanged at 2.0 %.
By contrast, the salary level trend assumption is subject
to a comparatively low level of sensitivity within the
BMW Group. The calculation of the salary level trend in
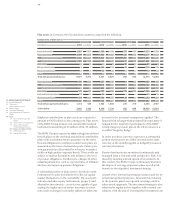
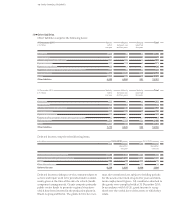
The following mortality tables are applied in countries, in which the BMW Group has significant defined benefit plans:
the UK also takes account of restrictions due to caps and
floors.
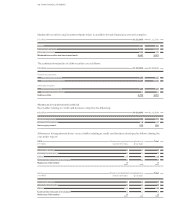
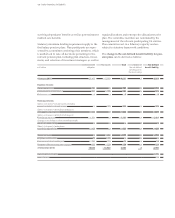
Based on the measurement principles contained in
IAS 19, the following balance sheet carrying amounts
apply to the Group’s pension plans:
31 December Germany United Kingdom Other To t a l
in € million 2015 2014 2015 2014 2015 2014 2015 2014
Present value of defined benefit obligations 9,215 9,636 9,327 9,499 1,384 1,327 19,926 20,462
Fair value of plan assets 7,855 7,323 8,153 7,734 922 804 16,930 15,861
Effect of limiting net defined benefit asset to asset ceiling – – – – 3 2 3 2
Carrying amounts at 31 December 1,360 2,313 1,174 1,765 465 525 2,999 4,603
thereof pension provision 1,360 2,313 1,174 1,765 466 526 3,000 4,604
thereof assets – – – – – 1 – 1 – 1 – 1
Germany Mortality Table 2005 G issued by Prof. K. Heubeck (with invalidity rates reduced by 50 %)
United Kingdom S1PA tables weighted accordingly, and S1NA tables minus 2 years, both with a minimum long term annual improvement allowance
USA RP2014 Mortality Table with collar adjustments projected with MP2015