BMW 2015 Annual Report Download - page 52
Download and view the complete annual report
Please find page 52 of the 2015 BMW annual report below. You can navigate through the pages in the report by either clicking on the pages listed below, or by using the keyword search tool below to find specific information within the annual report.-
 1
1 -
2
-
3
-
4
-
5
-
6
-
7
-
8
-
9
-
10
-
11
-
12
-
13
-
14
-
15
-
16
-
17
-
18
-
19
-
20
-
21
-
22
-
23
-
24
-
25
-
26
-
27
-
28
-
29
-
30
-
31
-
32
-
33
-
34
-
35
-
36
-
37
-
38
-
39
-
40
-
41
-
 42
42 -
 43
43 -
 44
44 -
 45
45 -
 46
46 -
 47
47 -
 48
48 -
 49
49 -
 50
50 -
 51
51 -
 52
52 -
 53
53 -
 54
54 -
 55
55 -
 56
56 -
 57
57 -
 58
58 -
 59
59 -
 60
60 -
 61
61 -
 62
62 -
63
-
64
-
65
-
66
-
67
-
68
-
69
-
70
-
71
-
72
-
73
-
74
-
75
-
76
-
77
-
78
-
79
-
80
-
81
-
82
-
83
-
84
-
85
-
86
-
87
-
88
-
89
-
90
-
91
-
92
-
93
-
94
-
95
-
96
-
97
-
98
-
99
-
100
-
101
-
102
-
103
-
104
-
105
-
106
-
107
-
108
-
109
-
110
-
111
-
112
-
113
-
114
-
115
-
116
-
117
-
118
-
119
-
120
-
121
-
122
-
123
-
124
-
125
-
126
-
127
-
128
-
129
-
130
-
131
-
132
-
133
-
134
-
135
-
136
-
137
-
138
-
139
-
140
-
141
-
142
-
143
-
144
-
145
-
146
-
147
-
148
-
149
-
150
-
151
-
152
-
153
-
154
-
155
-
156
-
157
-
158
-
159
-
160
-
161
-
162
-
163
-
164
-
165
-
166
-
167
-
168
-
169
-
170
-
171
-
172
-
173
-
174
-
175
-
176
-
177
-
178
-
179
-
180
-
181
-
182
-
183
-
184
-
185
-
186
-
187
-
188
-
189
-
190
-
191
-
192
-
193
-
194
-
195
-
196
-
197
-
198
-
199
-
200
-
201
-
202
-
203
-
204
-
205
-
206
-
207
-
208
-
209
-
210
 |
 |
52
18 COMBINED MANAGEMENT REPORT
18
General Information on the
BMW
Group
18 Business Model
20 Management System
23 Report on Economic Position
23 General and Sector-specific
Environment
27 Overall Assessment by Management
27
Financial and Non-financial
Performance Indicators
29 Review of Operations
49 Results of Operations, Financial
Position and Net Assets
59 Comments on Financial Statements
of BMW AG
62 Events after the End of the
Reporting Period
63 Report on Outlook, Risks and
Opportunities
63 Outlook
68 Report on Risks and Opportunities
81 Internal Control System and Risk
Management System Relevant for
the
Financial Reporting Process
83 Disclosures Relevant for Takeovers
and Explanatory Comments
87
BMW Stock and Capital Markets
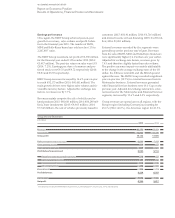
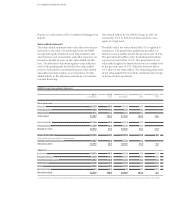
operating, investing and financing activities. Cash and
cash equivalents in the cash flow statements correspond
to the amount disclosed in the balance sheet.
Cash flows from operating activities are determined
indirectly, starting with Group and segment net profit.
By contrast, cash flows from investing and financing
activities are based on actual payments and receipts.
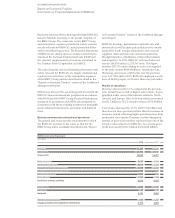
The cash inflow from operating activities in 2015 de-
creased by € 1,952 million to € 960 million (2014:
€ 2,912 million), mainly reflecting a € 2,739 million
increase in receivables from sales financing offset by
a
€ 298 million decrease in inventories (2014: increase
of € 971 million).
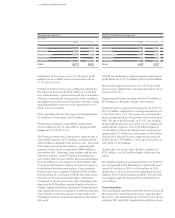
The cash outflow for investing activities amounted to
€ 7,603 million (2014: € 6,116 million) and was thus 24.3 %
higher than in the previous year. The principal reasons
for the higher cash outflow were a € 647 million increase
in expenditure for investments (2014: € 99 million)
relating to the acquisition of a shareholding in THERE
Holding B.V., Amsterdam, (accounted for at equity) for
an amount of € 668 million and a € 1,077 million increase
in the net outflow for investments in marketable secu-
rities and term deposits with longer terms (2015: out-
flow of € 1,221 million). The net outflow for these items
comprises investments in marketable securities and
term deposits on the one hand, and proceeds from the
sale of marketable securities and the expiry of term de-
posits on the other.
Further information on investments is provided in the
section on the net assets position.
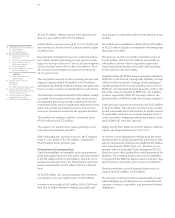
Cash inflow from financing activities totalled € 5,004 mil-
lion
(2014: € 3,133 million). Proceeds from the issue of
bonds brought in € 13,007 million (2014: € 10,892
mil-
lion), compared with an outflow of € 8,908 million (2014:
€ 7,249 million) for the repayment of bonds. Non-cur-
rent other financial liabilities resulted in a cash inflow
of € 9,715 million (2014: € 5,900 million) and a cash
outflow of € 8,802 million (2014: € 5,697 million). The net
cash inflow for current other financial liabilities was
€ 2,648 million (2014: € 2,132 million). The change in
commercial paper gave rise to a net cash outflow of
€ 498 million (2014: € 1,012 million). The payment of
dividends resulted in a cash outflow of € 1,917 million
(2014: € 1,715 million).
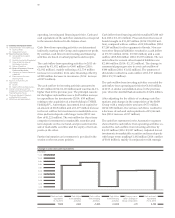
The cash outflow from investing activities exceeded the
cash inflow from operating activities by € 6,643 million
in 2015. A similar constellation arose in the previous
year, when the shortfall had amounted to € 3,204 million.
After adjusting for the effects of exchange rate fluc-
tuations
and changes in the composition of the BMW
Group with a total positive amount of € 73 million
(2014: € 88 million), the various cash flows resulted in
a
decrease of cash and cash equivalents of € 1,566 mil-
lion (2014: increase of € 17 million).
The cash flow statement for the Automotive segment
shows that the cash inflow from operating activities ex-
ceeded the cash outflow from investing activities by
€ 4,312 million (2014: € 3,587 million). Adjusted for net
investments in marketable securities and term deposits
with longer terms totalling € 1,092 million (2014: outflow
of € 106 million), mainly in conjunction with strategic
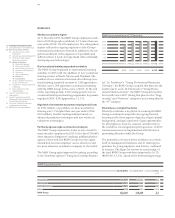
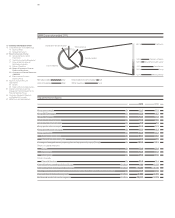
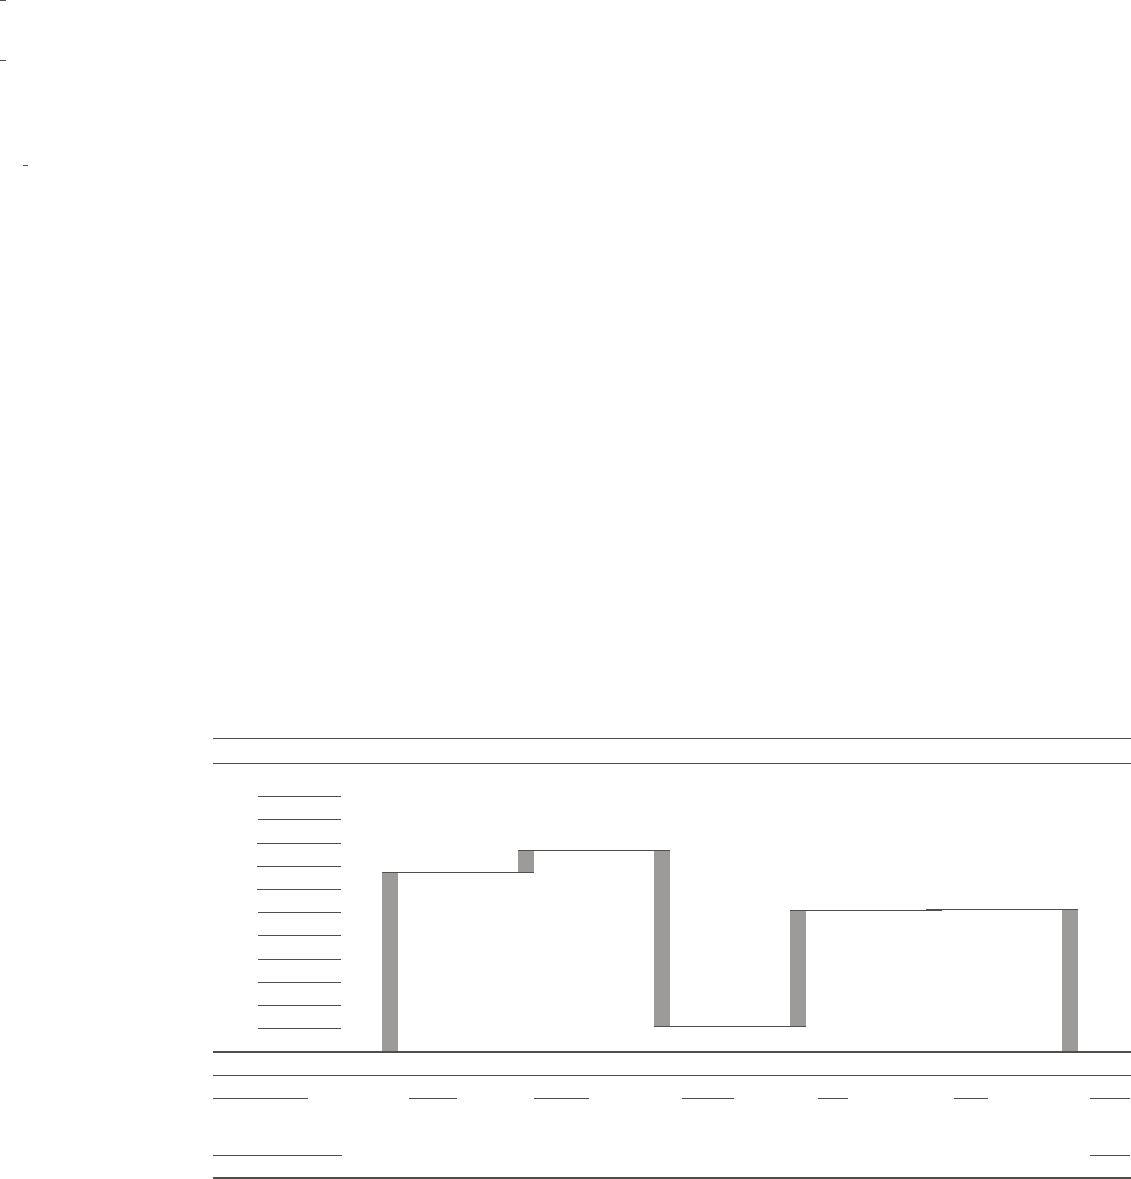
Change in cash and cash equivalents
in € million
11,000
10,000
9,000
8,000
7,000
6,000
5,000
4,000
3,000
2,000
1,000
Cash and cash Cash inflow Cash outflow Cash inflow Currency trans- Cash and cash
equivalents from operating from investing from financing lation, changes in equivalents
31.12. 2014 activities activities activities Group composition 31.12. 2015
7,688 + 960 – 7,603 + 5,004 + 73 6,122