BMW 2015 Annual Report Download - page 56
Download and view the complete annual report
Please find page 56 of the 2015 BMW annual report below. You can navigate through the pages in the report by either clicking on the pages listed below, or by using the keyword search tool below to find specific information within the annual report.-
 1
1 -
2
-
3
-
4
-
5
-
6
-
7
-
8
-
9
-
10
-
11
-
12
-
13
-
14
-
15
-
16
-
17
-
18
-
19
-
20
-
21
-
22
-
23
-
24
-
25
-
26
-
27
-
28
-
29
-
30
-
31
-
32
-
33
-
34
-
35
-
36
-
37
-
38
-
39
-
40
-
41
-
42
-
43
-
44
-
45
-
 46
46 -
 47
47 -
 48
48 -
 49
49 -
 50
50 -
 51
51 -
 52
52 -
 53
53 -
 54
54 -
 55
55 -
 56
56 -
 57
57 -
 58
58 -
 59
59 -
 60
60 -
 61
61 -
 62
62 -
 63
63 -
 64
64 -
 65
65 -
 66
66 -
67
-
68
-
69
-
70
-
71
-
72
-
73
-
74
-
75
-
76
-
77
-
78
-
79
-
80
-
81
-
82
-
83
-
84
-
85
-
86
-
87
-
88
-
89
-
90
-
91
-
92
-
93
-
94
-
95
-
96
-
97
-
98
-
99
-
100
-
101
-
102
-
103
-
104
-
105
-
106
-
107
-
108
-
109
-
110
-
111
-
112
-
113
-
114
-
115
-
116
-
117
-
118
-
119
-
120
-
121
-
122
-
123
-
124
-
125
-
126
-
127
-
128
-
129
-
130
-
131
-
132
-
133
-
134
-
135
-
136
-
137
-
138
-
139
-
140
-
141
-
142
-
143
-
144
-
145
-
146
-
147
-
148
-
149
-
150
-
151
-
152
-
153
-
154
-
155
-
156
-
157
-
158
-
159
-
160
-
161
-
162
-
163
-
164
-
165
-
166
-
167
-
168
-
169
-
170
-
171
-
172
-
173
-
174
-
175
-
176
-
177
-
178
-
179
-
180
-
181
-
182
-
183
-
184
-
185
-
186
-
187
-
188
-
189
-
190
-
191
-
192
-
193
-
194
-
195
-
196
-
197
-
198
-
199
-
200
-
201
-
202
-
203
-
204
-
205
-
206
-
207
-
208
-
209
-
210
 |
 |

56
18 COMBINED MANAGEMENT REPORT
18
General Information on the
BMW
Group
18 Business Model
20 Management System
23 Report on Economic Position
23 General and Sector-specific
Environment
27 Overall Assessment by Management
27
Financial and Non-financial
Performance Indicators
29 Review of Operations
49 Results of Operations, Financial
Position and Net Assets
59 Comments on Financial Statements
of BMW AG
62 Events after the End of the
Reporting Period
63 Report on Outlook, Risks and
Opportunities
63 Outlook
68 Report on Risks and Opportunities
81 Internal Control System and Risk
Management System Relevant for
the
Financial Reporting Process
83 Disclosures Relevant for Takeovers
and Explanatory Comments
87
BMW Stock and Capital Markets
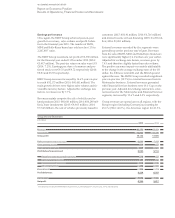
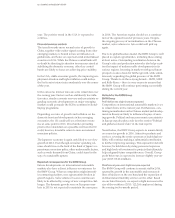
The Group equity ratio at the end of the reporting period
was 24.8 % (31 December 2014: 24.2 %). The equity ratio
of the Automotive segment was 40.1 % (31 December
2014: 39.2 %) and that of the Financial Services segment
was 8.2 % (31 December 2014: 8.8 %).
Overall, the results of operations, financial position and
net assets position of the BMW Group continued to de-
velop positively during the year under report.
Compensation Report
The compensation of the Board of Management com-
prises
both a fixed and a variable component. Bene-
fits are also payable – primarily in the form of pension
benefits – at the end of members’ mandates.
Further
details, including an analysis of remuneration by
each individual, are disclosed in the Compensation
Report, which can be found in the section “Statement
on Corporate Governance”. The Compensation
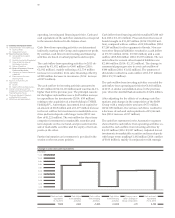
Balance sheet structure – Group
Total equity and liabilities in € billion
2015 2014 2014 2015
172 155 155 172
Non-current assets 64 %
5 %
37 %
63 %
38 %
38 %
24 %
36 %
Current assets
4 %
thereof cash and cash equivalents
37 % Non-current provisions and liabilities
38 % Current provisions and liabilities
25 % Equity
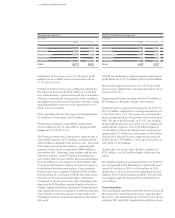
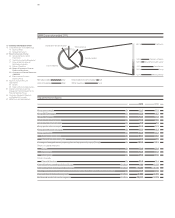
Balance sheet structure – Automotive segment
Total equity and liabilities in € billion
2015 2014 2014 2015
83 79 79 83
Non-current assets 48 %
7 %
54 %
46 %
43 %
18 %
39 %
52 %
Current assets
5 %
thereof cash and cash equivalents
17 % Non-current provisions and liabilities
43 % Current provisions and liabilities
40 % Equity