BMW 2015 Annual Report Download - page 139
Download and view the complete annual report
Please find page 139 of the 2015 BMW annual report below. You can navigate through the pages in the report by either clicking on the pages listed below, or by using the keyword search tool below to find specific information within the annual report.-
 1
1 -
2
-
3
-
4
-
5
-
6
-
7
-
8
-
9
-
10
-
11
-
12
-
13
-
14
-
15
-
16
-
17
-
18
-
19
-
20
-
21
-
22
-
23
-
24
-
25
-
26
-
27
-
28
-
29
-
30
-
31
-
32
-
33
-
34
-
35
-
36
-
37
-
38
-
39
-
40
-
41
-
42
-
43
-
44
-
45
-
46
-
47
-
48
-
49
-
50
-
51
-
52
-
53
-
54
-
55
-
56
-
57
-
58
-
59
-
60
-
61
-
62
-
63
-
64
-
65
-
66
-
67
-
68
-
69
-
70
-
71
-
72
-
73
-
74
-
75
-
76
-
77
-
78
-
79
-
80
-
81
-
82
-
83
-
84
-
85
-
86
-
87
-
88
-
89
-
90
-
91
-
92
-
93
-
94
-
95
-
96
-
97
-
98
-
99
-
100
-
101
-
102
-
103
-
104
-
105
-
106
-
107
-
108
-
109
-
110
-
111
-
112
-
113
-
114
-
115
-
116
-
117
-
118
-
119
-
120
-
121
-
122
-
123
-
124
-
125
-
126
-
127
-
128
-
 129
129 -
 130
130 -
 131
131 -
 132
132 -
 133
133 -
 134
134 -
 135
135 -
 136
136 -
 137
137 -
 138
138 -
 139
139 -
 140
140 -
 141
141 -
 142
142 -
 143
143 -
 144
144 -
 145
145 -
 146
146 -
 147
147 -
 148
148 -
 149
149 -
150
-
151
-
152
-
153
-
154
-
155
-
156
-
157
-
158
-
159
-
160
-
161
-
162
-
163
-
164
-
165
-
166
-
167
-
168
-
169
-
170
-
171
-
172
-
173
-
174
-
175
-
176
-
177
-
178
-
179
-
180
-
181
-
182
-
183
-
184
-
185
-
186
-
187
-
188
-
189
-
190
-
191
-
192
-
193
-
194
-
195
-
196
-
197
-
198
-
199
-
200
-
201
-
202
-
203
-
204
-
205
-
206
-
207
-
208
-
209
-
210
 |
 |

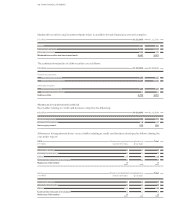
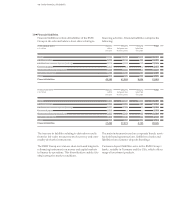
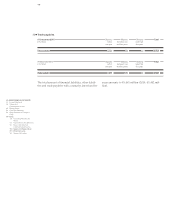
139 GROUP FINANCIAL STATEMENTS
The net defined benefit liability for pension plans in Germany, the UK and other countries changed as follows:
Germany
Defined benefit obligation Plan assets Net liability
in € million 2015 2014 2015 2014 2015 2014
1 January 9,636 7,400 – 7,323 – 6,749 2,313 651
Expense (+) / income (–) 518 475 – 155 – 237 363 238
Remeasurements – 825 1,872 – 7 – 351 – 832 1,521
Payments to external funds – – – 490 – 97 – 490 – 97
Employee contributions 53 48 – 53 – 48 – –
Payments on account and pension payments – 167 – 159 173 159 6 –
31 December 9,215 9,636 – 7,855 – 7,323 1,360 2,313
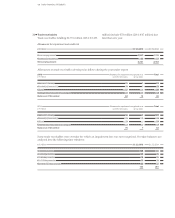
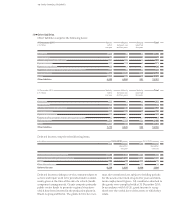
United Kingdom
Defined benefit obligation Plan assets Net liability
in € million 2015 2014 2015 2014 2015 2014
1 January 9,499 7,409 – 7,734 – 6,076 1,765 1,333
Expense (+) / income (–) 449 405 – 283 – 275 166 130
Remeasurements – 876 1,390 294 – 990 – 582 400
Payments to external funds – – – 295 – 212 – 295 – 212
Employee contributions 23 20 – 23 – 20 – –
Payments on account and pension payments – 326 – 294 334 302 8 8
Translation differences and other changes 558 569 – 446 – 463 112 106
31 December 9,327 9,499 – 8,153 – 7,734 1,174 1,765
Other
Defined benefit Plan assets Effect of limiting the Net liability
obligation net defined benefit
asset to the asset ceiling
in € million 2015 2014 2015 2014 2015 2014 2015 2014
1 January 1,327 949 – 804 – 636 2 4 525 317
Expense (+) / income (–) 109 74 – 30 – 28 – – 79 46
Remeasurements – 133 257 38 – 53 1 – 1 – 94 203
Payments to external funds – – – 87 – 74 – – – 87 – 74
Employee contributions 3 3 – 3 – 3 – – – –
Payments on account and pension payments – 47 – 66 47 61 – – – – 5
Translation differences and other changes 125 110 – 83 – 71 – – 1 42 38
31 December 1,384 1,327 – 922 – 804 3 2 465 525
Depending on the cash flow profile and risk structure of the pension obligations involved, pension plan assets are
invested in various investment classes.