BMW 2015 Annual Report Download - page 55
Download and view the complete annual report
Please find page 55 of the 2015 BMW annual report below. You can navigate through the pages in the report by either clicking on the pages listed below, or by using the keyword search tool below to find specific information within the annual report.-
 1
1 -
2
-
3
-
4
-
5
-
6
-
7
-
8
-
9
-
10
-
11
-
12
-
13
-
14
-
15
-
16
-
17
-
18
-
19
-
20
-
21
-
22
-
23
-
24
-
25
-
26
-
27
-
28
-
29
-
30
-
31
-
32
-
33
-
34
-
35
-
36
-
37
-
38
-
39
-
40
-
41
-
42
-
43
-
44
-
 45
45 -
 46
46 -
 47
47 -
 48
48 -
 49
49 -
 50
50 -
 51
51 -
 52
52 -
 53
53 -
 54
54 -
 55
55 -
 56
56 -
 57
57 -
 58
58 -
 59
59 -
 60
60 -
 61
61 -
 62
62 -
 63
63 -
 64
64 -
 65
65 -
66
-
67
-
68
-
69
-
70
-
71
-
72
-
73
-
74
-
75
-
76
-
77
-
78
-
79
-
80
-
81
-
82
-
83
-
84
-
85
-
86
-
87
-
88
-
89
-
90
-
91
-
92
-
93
-
94
-
95
-
96
-
97
-
98
-
99
-
100
-
101
-
102
-
103
-
104
-
105
-
106
-
107
-
108
-
109
-
110
-
111
-
112
-
113
-
114
-
115
-
116
-
117
-
118
-
119
-
120
-
121
-
122
-
123
-
124
-
125
-
126
-
127
-
128
-
129
-
130
-
131
-
132
-
133
-
134
-
135
-
136
-
137
-
138
-
139
-
140
-
141
-
142
-
143
-
144
-
145
-
146
-
147
-
148
-
149
-
150
-
151
-
152
-
153
-
154
-
155
-
156
-
157
-
158
-
159
-
160
-
161
-
162
-
163
-
164
-
165
-
166
-
167
-
168
-
169
-
170
-
171
-
172
-
173
-
174
-
175
-
176
-
177
-
178
-
179
-
180
-
181
-
182
-
183
-
184
-
185
-
186
-
187
-
188
-
189
-
190
-
191
-
192
-
193
-
194
-
195
-
196
-
197
-
198
-
199
-
200
-
201
-
202
-
203
-
204
-
205
-
206
-
207
-
208
-
209
-
210
 |
 |
55 COMBINED MANAGEMENT REPORT
creased by 21.1 %, mainly as a result of the purchase of
marketable securities.
Cash and cash equivalents went down by € 1,566 million
to € 6,122 million, due to investments made in mar-
ketable
securities. Changes in cash and cash equiva-
lents are described in the “Financial position” section.
On the equity and liabilities side of the balance sheet,
increases were recorded for non-current and current
finan cial liabilities (14.7 % and 12.5 % respectively),
Group
equity (14.2 %) and current other provisions
(18.4 %). By contrast, pension provisions decreased
by
34.8 %.
Non-current and current financial liabilities increased
from € 80,649 million to € 91,683 million over the twelve-
month period. Adjusted for currency factors, the in-
crease was 10.1 %. The execution of new ABS transac-
tions
and the issue of new bonds were the main factors
driving the increase in non-current and current finan-
cial liabilities.
Group equity rose by € 5,327 million to € 42,764 million,
increased primarily by the profit attributable to share-
holders of BMW AG (€ 6,369 million). The dividend paid
by BMW AG reduced equity by € 1,904 million. Equity
increased as a result of the positive impact arising on
the currency translation of foreign subsidiaries’ finan-
cial statements (€ 765 million) and on remeasurements
of the net defined benefit liability for pension plans
(€ 1,413 million), the latter attributable primarily to the
higher discount rates applied in Germany, the UK and
the USA. In addition, deferred taxes on items recognised
directly in equity increased equity by € 115 million.
Group equity was reduced by net fair value losses on
derivative financial instruments (€ 1,301 million) and
on marketable securities (€ 170 million). Other items in-
creased equity by € 40 million.
Current other liabilities went up by € 1,433 million to
€ 9,208 million, partly due to increases in deposits re-
ceived,
advance payments from customers, and in-
creases in other taxes.
The change in deferred income
due to greater volumes of service contracts, Connected
Drive offers and leasing business also contributed to
the increase.
Pension provisions decreased from € 4,604 million to
€ 3,000 million over the twelve-month period, mainly as
a result of the higher discount factors used in Germany,
the UK and the USA.
Further information with respect to financial liabilities
is provided in notes 34, 38 and 42 to the Group Financial
Statements.
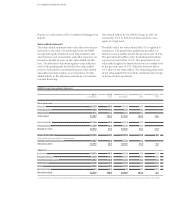
Net assets
The Group balance sheet total increased by € 17,371 mil-
lion (11.2 %) compared to the end of the previous finan-
cial
year to stand at € 172,174 million at 31 December
2015. Adjusted for exchange rate factors, the balance
sheet total increased by 7.7 %. The currency impact
was
mainly attributable to the appreciation in the value
of a number of currencies against the euro, most nota-
bly the US dollar, the British pound and the Chinese
renminbi.
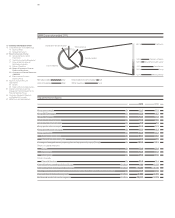
The increase in non-current assets on the assets side of
the balance sheet related primarily to leased products
(15.9 %), receivables from sales financing (11.8 %) and
investments accounted for using the equity method
(105.2 %).
Within current assets, increases were registered in par-
ticular for receivables from sales financing (19.5 %) and
financial assets (23.2 %). By contrast, cash and cash
equivalents decreased by 20.4 %.
The growth in business reported by the Financial Services
segment is reflected in increases of € 4,592 million and
€ 4,427 million in current and non-current receivables
from sales financing respectively and in the higher level
of leased products (up by € 4,800 million). At 31 Decem-
ber 2015, leased products accounted for 20.3 % of total
assets (2014: 19.5 %). Adjusted for exchange rate factors,
leased products increased by 10.6 %. Non-current re-
ceivables from sales financing accounted for 24.3 %
(2014: 24.2 %) of total assets, current receivables from
sales financing for 16.4 % (2014: 15.2 %). Adjusted for ex-
change rate factors, non-current receivables from sales
financing went up by 7.7 %, current receivables from
sales financing by 14.5 %.
Investments accounted for using the equity method were
€ 1,145 million higher at € 2,233 million, whereby the
increase was mainly attributable to the first-time con-
solidation of THERE Holding B. V., Amsterdam, and the
BMW Group’s share of earnings of the BMW Brilliance
Automotive Ltd., Shenyang, joint venture.
Other current financial assets went up by € 1,251 million
compared to 31 December 2014 to stand at € 6,635 mil-
lion and accounted for 3.9 % (2014: 3.5 %) of total assets.
Adjusted for exchange rate factors, financial assets in-