BMW 2015 Annual Report Download - page 159
Download and view the complete annual report
Please find page 159 of the 2015 BMW annual report below. You can navigate through the pages in the report by either clicking on the pages listed below, or by using the keyword search tool below to find specific information within the annual report.-
 1
1 -
2
-
3
-
4
-
5
-
6
-
7
-
8
-
9
-
10
-
11
-
12
-
13
-
14
-
15
-
16
-
17
-
18
-
19
-
20
-
21
-
22
-
23
-
24
-
25
-
26
-
27
-
28
-
29
-
30
-
31
-
32
-
33
-
34
-
35
-
36
-
37
-
38
-
39
-
40
-
41
-
42
-
43
-
44
-
45
-
46
-
47
-
48
-
49
-
50
-
51
-
52
-
53
-
54
-
55
-
56
-
57
-
58
-
59
-
60
-
61
-
62
-
63
-
64
-
65
-
66
-
67
-
68
-
69
-
70
-
71
-
72
-
73
-
74
-
75
-
76
-
77
-
78
-
79
-
80
-
81
-
82
-
83
-
84
-
85
-
86
-
87
-
88
-
89
-
90
-
91
-
92
-
93
-
94
-
95
-
96
-
97
-
98
-
99
-
100
-
101
-
102
-
103
-
104
-
105
-
106
-
107
-
108
-
109
-
110
-
111
-
112
-
113
-
114
-
115
-
116
-
117
-
118
-
119
-
120
-
121
-
122
-
123
-
124
-
125
-
126
-
127
-
128
-
129
-
130
-
131
-
132
-
133
-
134
-
135
-
136
-
137
-
138
-
139
-
140
-
141
-
142
-
143
-
144
-
145
-
146
-
147
-
148
-
 149
149 -
 150
150 -
 151
151 -
 152
152 -
 153
153 -
 154
154 -
 155
155 -
 156
156 -
 157
157 -
 158
158 -
 159
159 -
 160
160 -
 161
161 -
 162
162 -
 163
163 -
 164
164 -
 165
165 -
 166
166 -
 167
167 -
 168
168 -
 169
169 -
170
-
171
-
172
-
173
-
174
-
175
-
176
-
177
-
178
-
179
-
180
-
181
-
182
-
183
-
184
-
185
-
186
-
187
-
188
-
189
-
190
-
191
-
192
-
193
-
194
-
195
-
196
-
197
-
198
-
199
-
200
-
201
-
202
-
203
-
204
-
205
-
206
-
207
-
208
-
209
-
210
 |
 |

159 GROUP FINANCIAL STATEMENTS
43
In the next stage, these exposures are compared to all
hedges that are in place. The net cash flow surplus
represents an uncovered risk position. The cash-flow-at-
risk approach involves allocating the impact of potential
raw materials fluctuations to operating cash flows on
the basis of probability distributions. Volatilities and
cor-
relations serve as input factors to assess the relevant
probability distributions.
The potential negative impact on earnings is computed
for each raw material category for the following finan-
cial year on the basis of current market prices and ex-
Raw materials price risk
The BMW Group is exposed to the risk of price
fluctua-
tions for raw materials. A description of the management
of these risks is provided in the Combined Management
Report.
Explanatory notes to the cash flow statements
The cash flow statements show how the cash and cash
equivalents of the BMW Group and of the Automotive
and Financial Services segments have changed in the
course of the year as a result of cash inflows and cash
outflows. In accordance with IAS 7 (Statement of Cash
Flows), cash flows are classified into cash flows from op-
erating, investing and financing activities.
Cash and cash equivalents included in the cash flow
statement comprise cash on hand, cheques, and cash at
bank, to the extent that they are available within three
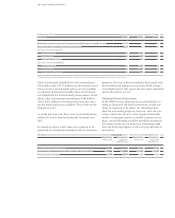
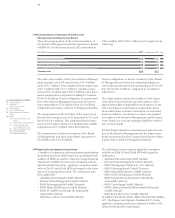
In the following table the potential volumes of fair value
fluctuations – measured on the basis of the value-at-risk
approach – are compared with the expected value for
the interest-rate-sensitive exposures of the BMW Group:
posure to a confidence level of 95 % and a holding
period of up to one year. Correlations between the
various categories of raw materials are taken into ac-
count when the risks are aggregated, thus reducing
the overall risk.
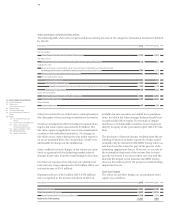
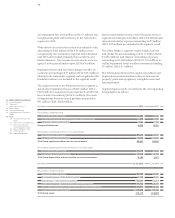
The following table shows the potential negative impact
for the BMW Group – measured on the basis of the
cash-flow-at-risk approach – attributable to fluctuations
in prices across all categories of raw materials. The risk
at each reporting date for the following financial year was
as follows:
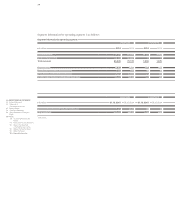
The first step in the analysis of the raw materials price
risk is to determine the volume of planned purchases of
raw materials (and components containing those raw
materials). These amounts, which represent the gross
exposure, were as follows at each reporting date for the
following financial year:
months from the end of the reporting period and are
subject to an insignificant risk of changes in value.
The cash flows from investing and financing activities
are based on actual payments and receipts. By con-
trast,
the cash flow from operating activities is derived
indirectly from the net profit for the year. Under this
method, changes in assets and liabilities relating to op-
erating
activities are adjusted for currency translation
effects and changes in the composition of the Group. The
changes in balance sheet positions shown in the cash
flow statement do not therefore agree directly with the
in € million 31. 12. 2015 31. 12. 2014
Euro 472 398
US Dollar 449 347
British Pound 186 108
Chinese Renminbi 33 44
Japanese Yen 12 11
in € million 31. 12. 2015 31. 12. 2014
Raw materials price exposures 3,720 3,770
in € million 31. 12. 2015 31. 12. 2014
Cash flow at risk 155 230