BMW 2015 Annual Report Download - page 118
Download and view the complete annual report
Please find page 118 of the 2015 BMW annual report below. You can navigate through the pages in the report by either clicking on the pages listed below, or by using the keyword search tool below to find specific information within the annual report.-
 1
1 -
2
-
3
-
4
-
5
-
6
-
7
-
8
-
9
-
10
-
11
-
12
-
13
-
14
-
15
-
16
-
17
-
18
-
19
-
20
-
21
-
22
-
23
-
24
-
25
-
26
-
27
-
28
-
29
-
30
-
31
-
32
-
33
-
34
-
35
-
36
-
37
-
38
-
39
-
40
-
41
-
42
-
43
-
44
-
45
-
46
-
47
-
48
-
49
-
50
-
51
-
52
-
53
-
54
-
55
-
56
-
57
-
58
-
59
-
60
-
61
-
62
-
63
-
64
-
65
-
66
-
67
-
68
-
69
-
70
-
71
-
72
-
73
-
74
-
75
-
76
-
77
-
78
-
79
-
80
-
81
-
82
-
83
-
84
-
85
-
86
-
87
-
88
-
89
-
90
-
91
-
92
-
93
-
94
-
95
-
96
-
97
-
98
-
99
-
100
-
101
-
102
-
103
-
104
-
105
-
106
-
107
-
 108
108 -
 109
109 -
 110
110 -
 111
111 -
 112
112 -
 113
113 -
 114
114 -
 115
115 -
 116
116 -
 117
117 -
 118
118 -
 119
119 -
 120
120 -
 121
121 -
 122
122 -
 123
123 -
 124
124 -
 125
125 -
 126
126 -
 127
127 -
 128
128 -
129
-
130
-
131
-
132
-
133
-
134
-
135
-
136
-
137
-
138
-
139
-
140
-
141
-
142
-
143
-
144
-
145
-
146
-
147
-
148
-
149
-
150
-
151
-
152
-
153
-
154
-
155
-
156
-
157
-
158
-
159
-
160
-
161
-
162
-
163
-
164
-
165
-
166
-
167
-
168
-
169
-
170
-
171
-
172
-
173
-
174
-
175
-
176
-
177
-
178
-
179
-
180
-
181
-
182
-
183
-
184
-
185
-
186
-
187
-
188
-
189
-
190
-
191
-
192
-
193
-
194
-
195
-
196
-
197
-
198
-
199
-
200
-
201
-
202
-
203
-
204
-
205
-
206
-
207
-
208
-
209
-
210
 |
 |

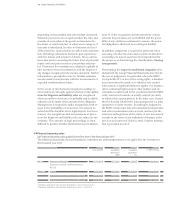
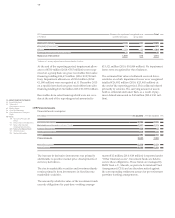
118
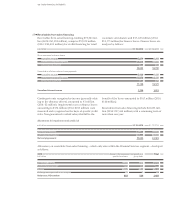
2015 2014
Net profit for the year after minority interest € million 6,369.4 5,798.1
Profit attributable to common stock € million 5,839.6 5,317.7
Profit attributable to preferred stock € million 529.8 480.4
Average number of common stock shares in circulation number 601,995,196 601,995,196
Average number of preferred stock shares in circulation number 54,499,460 54,259,767
Basic earnings per share of common stock € 9.70 8.83
Basic earnings per share of preferred stock € 9.72 8.85
Dividend per share of common stock € 3.20* 2.90
Dividend per share of preferred stock € 3.22* 2.92
* Proposal by management.
Earnings per share
17
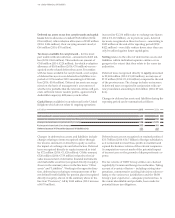
Personnel expenses include € 48 million (2014: € 42
mil-
lion) of expenditure incurred to adjust the workforce size.
The average number of employees during the year
was:
Basic earnings per share of preferred stock are
com-
puted on the basis of the number of preferred stock
shares entitled to receive a dividend in each of the
The number of employees at the end of the reporting period is disclosed in the Combined Management Report.
Other disclosures relating to the income statement
Personnel expenses
The income statement includes personnel costs as follows:
relevant financial years. As in the previous year, diluted
earnings per share correspond to basic earnings per
share.
2015 2014
Employees 111,905 105,743
thereof 214 (2014: 186) at proportionately-consolidated entities
Apprentices and students gaining work experience 7,783 7,560
thereof 2 (2014: 2) at proportionately-consolidated entities
Average number of employees 119,688 113,303
in € million 2015 2014
Wages and salaries 8,887 8,094
Social security, retirement and welfare costs 1,983 1,670
thereof pension costs: € 1,250 million (2014: € 991 million)
Personnel expenses 10,870 9,764
18
90 GROUP FINANCIAL STATEMENTS
90 Income Statements
90 Statement of
Comprehensive Income
92 Balance Sheets
94 Cash Flow Statements
96 Group Statement of Changes in
Equity
98 Notes
98 Accounting Principles and
Policies
113 Notes to the Income Statement
121 Notes to the Statement
of Comprehensive Income
122
Notes to the Balance Sheet
147 Other Disclosures
163 Segment Information