BMW 2015 Annual Report Download - page 4
Download and view the complete annual report
Please find page 4 of the 2015 BMW annual report below. You can navigate through the pages in the report by either clicking on the pages listed below, or by using the keyword search tool below to find specific information within the annual report.-
 1
1 -
 2
2 -
 3
3 -
 4
4 -
 5
5 -
 6
6 -
 7
7 -
 8
8 -
 9
9 -
 10
10 -
 11
11 -
 12
12 -
 13
13 -
 14
14 -
 15
15 -
16
-
17
-
18
-
19
-
20
-
21
-
22
-
23
-
24
-
25
-
26
-
27
-
28
-
29
-
30
-
31
-
32
-
33
-
34
-
35
-
36
-
37
-
38
-
39
-
40
-
41
-
42
-
43
-
44
-
45
-
46
-
47
-
48
-
49
-
50
-
51
-
52
-
53
-
54
-
55
-
56
-
57
-
58
-
59
-
60
-
61
-
62
-
63
-
64
-
65
-
66
-
67
-
68
-
69
-
70
-
71
-
72
-
73
-
74
-
75
-
76
-
77
-
78
-
79
-
80
-
81
-
82
-
83
-
84
-
85
-
86
-
87
-
88
-
89
-
90
-
91
-
92
-
93
-
94
-
95
-
96
-
97
-
98
-
99
-
100
-
101
-
102
-
103
-
104
-
105
-
106
-
107
-
108
-
109
-
110
-
111
-
112
-
113
-
114
-
115
-
116
-
117
-
118
-
119
-
120
-
121
-
122
-
123
-
124
-
125
-
126
-
127
-
128
-
129
-
130
-
131
-
132
-
133
-
134
-
135
-
136
-
137
-
138
-
139
-
140
-
141
-
142
-
143
-
144
-
145
-
146
-
147
-
148
-
149
-
150
-
151
-
152
-
153
-
154
-
155
-
156
-
157
-
158
-
159
-
160
-
161
-
162
-
163
-
164
-
165
-
166
-
167
-
168
-
169
-
170
-
171
-
172
-
173
-
174
-
175
-
176
-
177
-
178
-
179
-
180
-
181
-
182
-
183
-
184
-
185
-
186
-
187
-
188
-
189
-
190
-
191
-
192
-
193
-
194
-
195
-
196
-
197
-
198
-
199
-
200
-
201
-
202
-
203
-
204
-
205
-
206
-
207
-
208
-
209
-
210
 |
 |

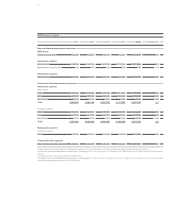
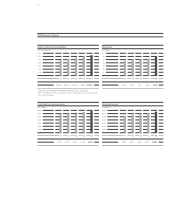
4
BMW Group in figures
2011 2012 2013 2014 2015 Change in %
Key financial performance indicators
BMW Group
Profit before tax € million 7,383 7,803 7,893 8,707 9,224 5.9
Automotive segment
Revenues € million 63,229 70,208 70,630 75,173 85,536 13.8
EBIT margin
% (change in %pts)
11.8 10.8 9.4 9.6 9.2 – 0.4
RoCE
% (change in %pts)
77.3 73.7 63.0 61.7 72.2 10.5
Motorcycles segment
RoCE
% (change in %pts)
10.2 1.8 16.4 21.8 31.6 9.8
Financial Services segment
RoE
% (change in %pts)
29.4 21.2 20.0 19.4 20.2 0.8
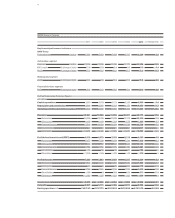
Further financial performance figures
in € million
Capital expenditure 3,692 5,240 6,711 6,100 5,890 – 3.4
Depreciation and amortisation 3,646 3,541 3,741 4,170 4,659 11.7
Operating cash flow Automotive segment 8,110 9,167 9,964 9,423 11,836 25.6
Revenues 68,821 76,848 76,059 80,401 92,175 14.6
Automotive 63,229 70,208 70,630 75,173 85,536 13.8
Motorcycles 1,436 1,490 1,504 1,679 1,990 18.5
Financial Services 17,510 19,550 19,874 20,599 23,739 15.2
Other Entities 5 5 6 7 7 –
Eliminations – 13,359 – 14,405 – 15,955 – 17,057 – 19,097 – 12.0
Profit before financial result (EBIT) 8,018 8,275 7,978 9,118 9,593 5.2
Automotive 7,477 7,599 6,649 7,244 7,836 8.2
Motorcycles 45 9 79 112 182 62.5
Financial Services 1,763 1,558 1,643 1,756 1,981 12.8
Other Entities – 19 58 44 71 169 –
Eliminations – 1,248 – 949 – 437 – 65 – 575 –
Profit before tax 7,383 7,803 7,893 8,707 9,224 5.9
Automotive 6,823 7,170 6,561 6,886 7,523 9.3
Motorcycles 41 6 76 107 179 67.3
Financial Services 1,790 1,561 1,619 1,723 1,975 14.6
Other Entities – 168 3 164 154 211 37.0
Eliminations – 1,103 – 937 – 527 – 163 – 664 –
Income taxes – 2,476 – 2,692 – 2,564 – 2,890 – 2,828 2.1
Net profit 4,907 5,111 5,329 5,817 6,396 10.0
Earnings per share in € 7.45 / 7.47 7.75 / 7.77 8.08 / 8.10 8.83 / 8.85 9.70 / 9.72 9.9 / 9.8