BMW 2015 Annual Report Download - page 22
Download and view the complete annual report
Please find page 22 of the 2015 BMW annual report below. You can navigate through the pages in the report by either clicking on the pages listed below, or by using the keyword search tool below to find specific information within the annual report.-
 1
1 -
2
-
3
-
4
-
5
-
6
-
7
-
8
-
9
-
10
-
11
-
 12
12 -
 13
13 -
 14
14 -
 15
15 -
 16
16 -
 17
17 -
 18
18 -
 19
19 -
 20
20 -
 21
21 -
 22
22 -
 23
23 -
 24
24 -
 25
25 -
 26
26 -
 27
27 -
 28
28 -
 29
29 -
 30
30 -
 31
31 -
 32
32 -
33
-
34
-
35
-
36
-
37
-
38
-
39
-
40
-
41
-
42
-
43
-
44
-
45
-
46
-
47
-
48
-
49
-
50
-
51
-
52
-
53
-
54
-
55
-
56
-
57
-
58
-
59
-
60
-
61
-
62
-
63
-
64
-
65
-
66
-
67
-
68
-
69
-
70
-
71
-
72
-
73
-
74
-
75
-
76
-
77
-
78
-
79
-
80
-
81
-
82
-
83
-
84
-
85
-
86
-
87
-
88
-
89
-
90
-
91
-
92
-
93
-
94
-
95
-
96
-
97
-
98
-
99
-
100
-
101
-
102
-
103
-
104
-
105
-
106
-
107
-
108
-
109
-
110
-
111
-
112
-
113
-
114
-
115
-
116
-
117
-
118
-
119
-
120
-
121
-
122
-
123
-
124
-
125
-
126
-
127
-
128
-
129
-
130
-
131
-
132
-
133
-
134
-
135
-
136
-
137
-
138
-
139
-
140
-
141
-
142
-
143
-
144
-
145
-
146
-
147
-
148
-
149
-
150
-
151
-
152
-
153
-
154
-
155
-
156
-
157
-
158
-
159
-
160
-
161
-
162
-
163
-
164
-
165
-
166
-
167
-
168
-
169
-
170
-
171
-
172
-
173
-
174
-
175
-
176
-
177
-
178
-
179
-
180
-
181
-
182
-
183
-
184
-
185
-
186
-
187
-
188
-
189
-
190
-
191
-
192
-
193
-
194
-
195
-
196
-
197
-
198
-
199
-
200
-
201
-
202
-
203
-
204
-
205
-
206
-
207
-
208
-
209
-
210
 |
 |

22
18 COMBINED MANAGEMENT REPORT
18
General Information on the
BMW
Group
18 Business Model
20 Management System
23 Report on Economic Position
23 General and Sector-specific
Environment
27 Overall Assessment by Management
27
Financial and Non-financial
Performance Indicators
29 Review of Operations
49 Results of Operations, Financial
Position and Net Assets
59 Comments on Financial Statements
of BMW AG
62 Events after the End of the
Reporting Period
63 Report on Outlook, Risks and
Opportunities
63 Outlook
68 Report on Risks and Opportunities
81 Internal Control System and Risk
Management System Relevant for
the
Financial Reporting Process
83 Disclosures Relevant for Takeovers
and Explanatory Comments
87
BMW Stock and Capital Markets
The cost of capital is the minimum rate of return ex-
pected
by capital providers in return for the capital
em-
ployed by the Group. Since capital employed com-
prises
an equity capital element (e. g. share capital) and
a debt capital element (e. g. bonds), the overall cost of
capital rate is determined on the basis of the weighted
average rates for equity and debt capital, measured
using standard market procedures. The pre-tax average
weighted cost of capital for the BMW Group in 2015
was
12 %, unchanged from the previous year.
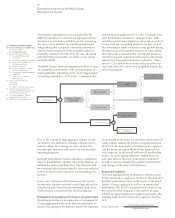
Value management used to control projects
Operations in the Automotive and Motorcycles
seg-
ments are shaped, to a large extent, by life-cycle-driven
project work. Projects have a substantial influence on
future performance. Project decisions are therefore a
crucial component of financial management for the
BMW Group.
Decisions are taken on the basis of project calculations
measured in terms of the cash flows each individual
project is expected to generate. Calculations are made
for the full term of a project, i. e. for all future years in
which the project generates cash flows. Project deci-
sions are taken on the basis of the capital value and in-
ternal rate of return calculated for the project.
The capital value of a project indicates the extent to
which a project will be able to generate a positive contri-
bution
to earnings over and above the cost of capital.
A project with a positive capital value enhances value
added and therefore results in an increase in the value
of the business. The internal rate of return of the project
corresponds to the average return on capital employed
in the project and, in terms of scope, is equivalent to
the multi-year average RoCE for an individual project. It
is therefore consistent with one of the key performance
indicators.
The criteria used for taking decisions as well as the
long-term impact on periodic earnings is documented
for all project decisions and incorporated in the long-
term Group forecast. This system enables an analysis of
the periodic reporting impact of project decisions on
earnings and rates of return over the term of each project.
The overall result is a cohesive controlling model.