BMW 2015 Annual Report Download - page 3
Download and view the complete annual report
Please find page 3 of the 2015 BMW annual report below. You can navigate through the pages in the report by either clicking on the pages listed below, or by using the keyword search tool below to find specific information within the annual report.-
 1
1 -
 2
2 -
 3
3 -
 4
4 -
 5
5 -
 6
6 -
 7
7 -
 8
8 -
 9
9 -
 10
10 -
 11
11 -
 12
12 -
 13
13 -
 14
14 -
15
-
16
-
17
-
18
-
19
-
20
-
21
-
22
-
23
-
24
-
25
-
26
-
27
-
28
-
29
-
30
-
31
-
32
-
33
-
34
-
35
-
36
-
37
-
38
-
39
-
40
-
41
-
42
-
43
-
44
-
45
-
46
-
47
-
48
-
49
-
50
-
51
-
52
-
53
-
54
-
55
-
56
-
57
-
58
-
59
-
60
-
61
-
62
-
63
-
64
-
65
-
66
-
67
-
68
-
69
-
70
-
71
-
72
-
73
-
74
-
75
-
76
-
77
-
78
-
79
-
80
-
81
-
82
-
83
-
84
-
85
-
86
-
87
-
88
-
89
-
90
-
91
-
92
-
93
-
94
-
95
-
96
-
97
-
98
-
99
-
100
-
101
-
102
-
103
-
104
-
105
-
106
-
107
-
108
-
109
-
110
-
111
-
112
-
113
-
114
-
115
-
116
-
117
-
118
-
119
-
120
-
121
-
122
-
123
-
124
-
125
-
126
-
127
-
128
-
129
-
130
-
131
-
132
-
133
-
134
-
135
-
136
-
137
-
138
-
139
-
140
-
141
-
142
-
143
-
144
-
145
-
146
-
147
-
148
-
149
-
150
-
151
-
152
-
153
-
154
-
155
-
156
-
157
-
158
-
159
-
160
-
161
-
162
-
163
-
164
-
165
-
166
-
167
-
168
-
169
-
170
-
171
-
172
-
173
-
174
-
175
-
176
-
177
-
178
-
179
-
180
-
181
-
182
-
183
-
184
-
185
-
186
-
187
-
188
-
189
-
190
-
191
-
192
-
193
-
194
-
195
-
196
-
197
-
198
-
199
-
200
-
201
-
202
-
203
-
204
-
205
-
206
-
207
-
208
-
209
-
210
 |
 |

3
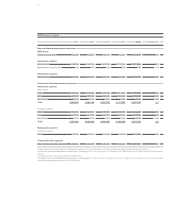
BMW Group in figures
2011 2012 2013 2014 2015 Change in %
Key non-financial performance indicators
BMW Group
Workforce at year-end1 100,306 105,876 110,351 116,324 122,244 5.1
Automotive segment
Sales volume2 1,668,982 1,845,186 1,963,798 2,117,965 2,247,485 6.1
Fleet emissions in g CO2 / km3 145 143 133 130 127 – 2.3
Motorcycles segment
Sales volume4 104,286 106,358 115,215 123,495 136,963 10.9
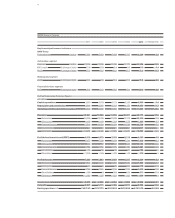
Further non-financial performance figures
Automotive segment
Sales volume
BMW 2 1,380,384 1,540,085 1,655,138 1,811,719 1,905,234 5.2
MINI 285,060 301,526 305,030 302,183 338,466 12.0
Rolls-Royce 3,538 3,575 3,630 4,063 3,785 – 6.8
Total21,668,982 1,845,186 1,963,798 2,117,965 2,247,485 6 . 1
Production volume
BMW 5 1,440,315 1,547,057 1,699,835 1,838,268 1,933,647 5.2
MINI 294,120 311,490 303,177 322,803 342,008 5.9
Rolls-Royce 3,725 3,279 3,354 4,495 3,848 – 14.4
Total51,738,160 1,861,826 2,006,366 2,165,566 2,279,503 5 . 3
Motorcycles segment
Production volume6
BMW 110,360 113,811 110,127 133,615 151,004 13.0
Financial Services segment
New contracts with retail customers 1,196,610 1,341,296 1,471,385 1,509,113 1,655,961 9.7
1 Figures exclude suspended contracts of employment, employees in the non-work phases of pre-retirement part-time arrangements and low income earners.
2 Including the joint venture BMW Brilliance Automotive Ltd., Shenyang (2011: 94,400 units, 2012: 141,165 units, 2013: 198,542 units, 2014:
275,891
units, 2015: 282,000 units).
3 EU-28.
4 Excluding Husqvarna, sales volume up to 2013: 59,776 units.
5 Including the joint venture BMW Brilliance Automotive Ltd., Shenyang (2011: 98,241 units, 2012: 150,052 units, 2013: 214,920 units, 2014: 287,466 units, 2015: 287,755 units).
6 Excluding Husqvarna, production up to 2013: 59,426 units.