BMW 2015 Annual Report Download - page 166
Download and view the complete annual report
Please find page 166 of the 2015 BMW annual report below. You can navigate through the pages in the report by either clicking on the pages listed below, or by using the keyword search tool below to find specific information within the annual report.-
 1
1 -
2
-
3
-
4
-
5
-
6
-
7
-
8
-
9
-
10
-
11
-
12
-
13
-
14
-
15
-
16
-
17
-
18
-
19
-
20
-
21
-
22
-
23
-
24
-
25
-
26
-
27
-
28
-
29
-
30
-
31
-
32
-
33
-
34
-
35
-
36
-
37
-
38
-
39
-
40
-
41
-
42
-
43
-
44
-
45
-
46
-
47
-
48
-
49
-
50
-
51
-
52
-
53
-
54
-
55
-
56
-
57
-
58
-
59
-
60
-
61
-
62
-
63
-
64
-
65
-
66
-
67
-
68
-
69
-
70
-
71
-
72
-
73
-
74
-
75
-
76
-
77
-
78
-
79
-
80
-
81
-
82
-
83
-
84
-
85
-
86
-
87
-
88
-
89
-
90
-
91
-
92
-
93
-
94
-
95
-
96
-
97
-
98
-
99
-
100
-
101
-
102
-
103
-
104
-
105
-
106
-
107
-
108
-
109
-
110
-
111
-
112
-
113
-
114
-
115
-
116
-
117
-
118
-
119
-
120
-
121
-
122
-
123
-
124
-
125
-
126
-
127
-
128
-
129
-
130
-
131
-
132
-
133
-
134
-
135
-
136
-
137
-
138
-
139
-
140
-
141
-
142
-
143
-
144
-
145
-
146
-
147
-
148
-
149
-
150
-
151
-
152
-
153
-
154
-
155
-
 156
156 -
 157
157 -
 158
158 -
 159
159 -
 160
160 -
 161
161 -
 162
162 -
 163
163 -
 164
164 -
 165
165 -
 166
166 -
 167
167 -
 168
168 -
 169
169 -
 170
170 -
 171
171 -
 172
172 -
 173
173 -
 174
174 -
 175
175 -
 176
176 -
177
-
178
-
179
-
180
-
181
-
182
-
183
-
184
-
185
-
186
-
187
-
188
-
189
-
190
-
191
-
192
-
193
-
194
-
195
-
196
-
197
-
198
-
199
-
200
-
201
-
202
-
203
-
204
-
205
-
206
-
207
-
208
-
209
-
210
 |
 |
166
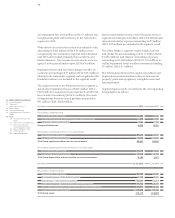
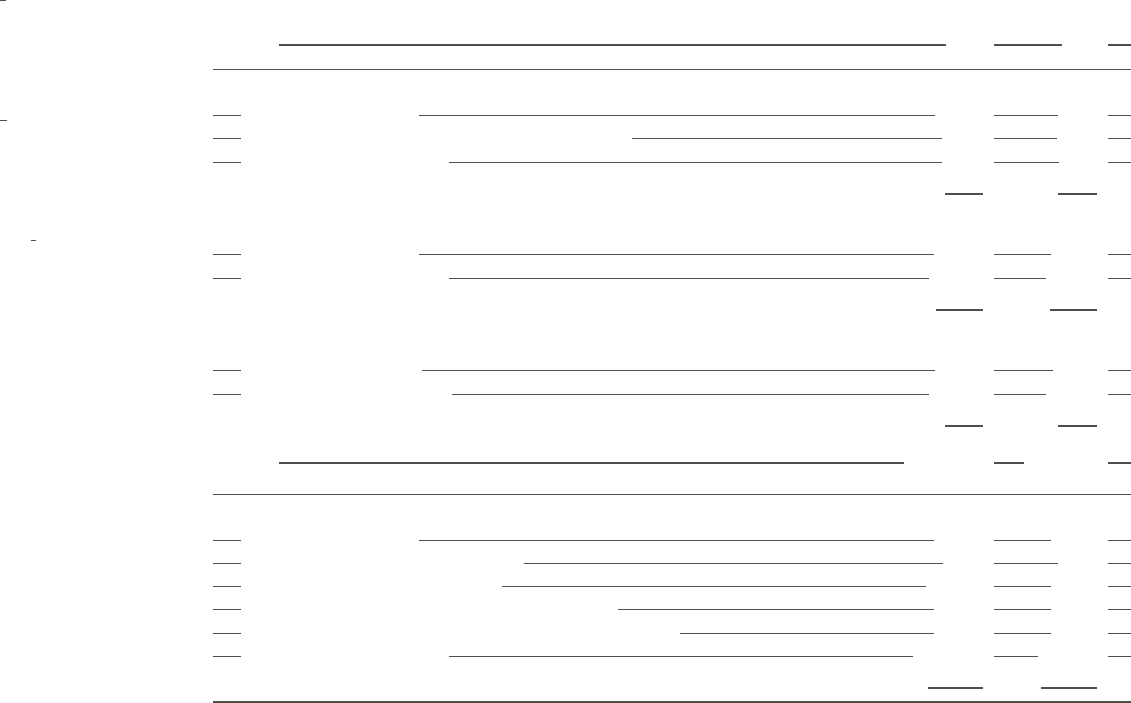
in € million 2015 2014
Reconciliation of segment result
Total for reportable segments 10,204 9,233
Financial result of Automotive segment and Motorcycles segment – 316 – 363
Elimination of inter-segment items – 664 – 163
Group profit before tax 9,224 8,707
Reconciliation of capital expenditure on non-current assets
Total for reportable segments 29,573 25,297
Elimination of inter-segment items – 5,672 – 4,621
Total Group capital expenditure on non-current assets 23,901 20,676
Reconciliation of depreciation and amortisation on non-current assets
Total for reportable segments 13,314 11,683
Elimination of inter-segment items – 5,119 – 4,112
Total Group depreciation and amortisation on non-current assets 8,195 7,571
in € million 31. 12. 2015 31. 12. 2014
Reconciliation of segment assets
Total for reportable segments 92,238 82,937
Non-operating assets – Other Entities segment 7,132 6,658
Total liabilities – Financial Services segment 112,081 96,959
Non-operating assets – Automotive and Motorcycles segments 41,932 39,449
Liabilities of Automotive and Motorcycles segments not subject to interest 31,817 28,488
Elimination of inter-segment items – 113,026 – 99,688
Total Group assets 172,174 154,803
An impairment loss of € 3 million (2014: € – million) was
recognised on plant and machinery in the Automotive
segment in 2015.
Write-downs on inventories to their net realisable value
amounting to € 486 million (2014: € 29 million) were
recognised by the Automotive segment in the financial
year 2015 and resulted primarily from accidents and
natural disasters. No reversals of write-downs were rec-
ognised in the period under report (2014: € 3 million).
Impairment losses and fair value changes on other in-
vestments amounting to € 17 million (2014: € 153 million)
relating to the Automotive segment and recognised in the
financial result are not included in the segment result.
The segment result of the Financial Services segment is
stated after impairment losses of € 406 million (2014:
€ 268 million) recognised on leased products and € 3 mil-
lion on other investments (2014: € – million). Reversals
of impairment losses on leased products amounted to
€ 81 million (2014: € 169 million).
Interest and similar income of the Financial Services
segment amounting to € 4 million (2014: € 4 million) and
interest and similar expenses amounting to € 7 million
(2014: € 29 million) are included in the segment result.
The Other Entities’ segment result includes interest
and similar income amounting to € 1,177 million (2014:
€ 1,295 million) and interest and similar expenses
amounting to € 1,080 million (2014: € 1,197 million) as
well as impairment losses on other investments totalling
€ 7 million (2014: € – million).
The information disclosed for capital expenditure and
depreciation and amortisation relates to non-current
property, plant and equipment, intangible assets and
leased products.
Segment figures can be reconciled to the corresponding
Group figures as follows:
90 GROUP FINANCIAL STATEMENTS
90 Income Statements
90 Statement of
Comprehensive Income
92 Balance Sheets
94 Cash Flow Statements
96 Group Statement of Changes in
Equity
98 Notes
98 Accounting Principles and
Policies
113 Notes to the Income Statement
121 Notes to the Statement
of Comprehensive Income
122
Notes to the Balance Sheet
147 Other Disclosures
163 Segment Information