BMW 2015 Annual Report Download - page 127
Download and view the complete annual report
Please find page 127 of the 2015 BMW annual report below. You can navigate through the pages in the report by either clicking on the pages listed below, or by using the keyword search tool below to find specific information within the annual report.-
 1
1 -
2
-
3
-
4
-
5
-
6
-
7
-
8
-
9
-
10
-
11
-
12
-
13
-
14
-
15
-
16
-
17
-
18
-
19
-
20
-
21
-
22
-
23
-
24
-
25
-
26
-
27
-
28
-
29
-
30
-
31
-
32
-
33
-
34
-
35
-
36
-
37
-
38
-
39
-
40
-
41
-
42
-
43
-
44
-
45
-
46
-
47
-
48
-
49
-
50
-
51
-
52
-
53
-
54
-
55
-
56
-
57
-
58
-
59
-
60
-
61
-
62
-
63
-
64
-
65
-
66
-
67
-
68
-
69
-
70
-
71
-
72
-
73
-
74
-
75
-
76
-
77
-
78
-
79
-
80
-
81
-
82
-
83
-
84
-
85
-
86
-
87
-
88
-
89
-
90
-
91
-
92
-
93
-
94
-
95
-
96
-
97
-
98
-
99
-
100
-
101
-
102
-
103
-
104
-
105
-
106
-
107
-
108
-
109
-
110
-
111
-
112
-
113
-
114
-
115
-
116
-
 117
117 -
 118
118 -
 119
119 -
 120
120 -
 121
121 -
 122
122 -
 123
123 -
 124
124 -
 125
125 -
 126
126 -
 127
127 -
 128
128 -
 129
129 -
 130
130 -
 131
131 -
 132
132 -
 133
133 -
 134
134 -
 135
135 -
 136
136 -
 137
137 -
138
-
139
-
140
-
141
-
142
-
143
-
144
-
145
-
146
-
147
-
148
-
149
-
150
-
151
-
152
-
153
-
154
-
155
-
156
-
157
-
158
-
159
-
160
-
161
-
162
-
163
-
164
-
165
-
166
-
167
-
168
-
169
-
170
-
171
-
172
-
173
-
174
-
175
-
176
-
177
-
178
-
179
-
180
-
181
-
182
-
183
-
184
-
185
-
186
-
187
-
188
-
189
-
190
-
191
-
192
-
193
-
194
-
195
-
196
-
197
-
198
-
199
-
200
-
201
-
202
-
203
-
204
-
205
-
206
-
207
-
208
-
209
-
210
 |
 |

127 GROUP FINANCIAL STATEMENTS
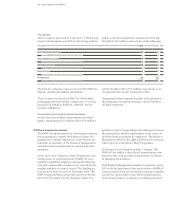
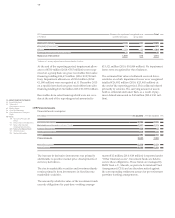
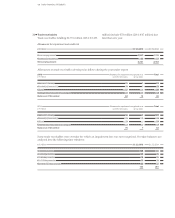
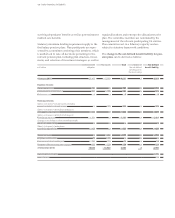
in € million 31. 12. 2015 31. 12. 2014
Gross investment in finance leases
due within one year 5,974 5,366
due between one and five years 12,816 11,231
due later than five years 134 109
18,924 16,706
Present value of future minimum lease payments
due within one year 5,429 4,898
due between one and five years 11,572 10,175
due later than five years 127 102
17,128 15,175
Unrealised interest income 1,796 1,531
27
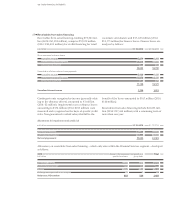
Receivables from sales financing
Receivables from sales financing, totalling € 70,043 mil-
lion (2014: € 61,024 million), comprise € 52,915 million
(2014: € 45,849 million) for credit financing for retail
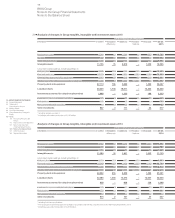
Allowances on receivables from sales financing – which only arise within the Financial Services segment – developed
as follows:
customers and dealers and € 17,128 million (2014:
€ 15,175 million) for finance leases. Finance leases are
analysed as follows:
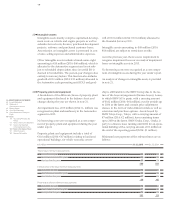
in € million 31. 12. 2015 31. 12. 2014
Gross carrying amount 71,536 62,539
Allowance for impairment – 1,493 – 1,515
Net carrying amount 70,043 61,024
2015 Allowance for impairment recognised on a Total
in € million specific item basis group basis
Balance at 1 January 1,000 515 1,515
Allocated (+) / reversed (–) 265 30 295
Utilised – 319 – 22 – 341
Exchange rate impact and other changes 17 7 24
Balance at 31 December 963 530 1,493
Contingent rents recognised as income (generally
relat-
ing to the distance driven) amounted to € 1 million
(2014: € 2 million). Impairment losses on finance leases
amounting to € 174 million (2014: € 183 million) were
measured and recognised on the basis of specific credit
risks. Non-guaranteed residual values that fall to the
benefit of the lessor amounted to € 165 million (2014:
€ 140 million).
Receivables from sales financing include € 41,865
mil-
lion (2014: € 37,438 million) with a remaining term of
more than one year.
Allowances for impairment and credit risk