BMW 2015 Annual Report Download - page 47
Download and view the complete annual report
Please find page 47 of the 2015 BMW annual report below. You can navigate through the pages in the report by either clicking on the pages listed below, or by using the keyword search tool below to find specific information within the annual report.-
 1
1 -
2
-
3
-
4
-
5
-
6
-
7
-
8
-
9
-
10
-
11
-
12
-
13
-
14
-
15
-
16
-
17
-
18
-
19
-
20
-
21
-
22
-
23
-
24
-
25
-
26
-
27
-
28
-
29
-
30
-
31
-
32
-
33
-
34
-
35
-
36
-
 37
37 -
 38
38 -
 39
39 -
 40
40 -
 41
41 -
 42
42 -
 43
43 -
 44
44 -
 45
45 -
 46
46 -
 47
47 -
 48
48 -
 49
49 -
 50
50 -
 51
51 -
 52
52 -
 53
53 -
 54
54 -
 55
55 -
 56
56 -
 57
57 -
58
-
59
-
60
-
61
-
62
-
63
-
64
-
65
-
66
-
67
-
68
-
69
-
70
-
71
-
72
-
73
-
74
-
75
-
76
-
77
-
78
-
79
-
80
-
81
-
82
-
83
-
84
-
85
-
86
-
87
-
88
-
89
-
90
-
91
-
92
-
93
-
94
-
95
-
96
-
97
-
98
-
99
-
100
-
101
-
102
-
103
-
104
-
105
-
106
-
107
-
108
-
109
-
110
-
111
-
112
-
113
-
114
-
115
-
116
-
117
-
118
-
119
-
120
-
121
-
122
-
123
-
124
-
125
-
126
-
127
-
128
-
129
-
130
-
131
-
132
-
133
-
134
-
135
-
136
-
137
-
138
-
139
-
140
-
141
-
142
-
143
-
144
-
145
-
146
-
147
-
148
-
149
-
150
-
151
-
152
-
153
-
154
-
155
-
156
-
157
-
158
-
159
-
160
-
161
-
162
-
163
-
164
-
165
-
166
-
167
-
168
-
169
-
170
-
171
-
172
-
173
-
174
-
175
-
176
-
177
-
178
-
179
-
180
-
181
-
182
-
183
-
184
-
185
-
186
-
187
-
188
-
189
-
190
-
191
-
192
-
193
-
194
-
195
-
196
-
197
-
198
-
199
-
200
-
201
-
202
-
203
-
204
-
205
-
206
-
207
-
208
-
209
-
210
 |
 |

47 COMBINED MANAGEMENT REPORT
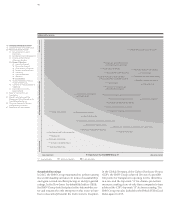
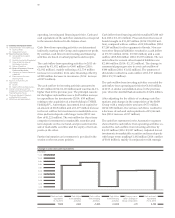
Energy consumption – 36.0 %
Water consumption – 31.3 %
Process wastewater – 45.1 %
Non-recyclable waste – 78.9 %
Solvent emissions – 51.4 %
CO2 emissions – 45.7 %
In 2015, the BMW Group reduced the consumption of
resources and emissions per vehicle produced by an
average of 7.0 % compared with the previous year, giving
rise to savings of € 8.2 million. The BMW Group again
cut the energy consumption per vehicle produced by
2.7 % to 2.19 MWh during the period under report (2014:
2.25 MWh). The utilisation of highly efficient, ecologically
sustainable combined heat and power plants (CHPs)
and electricity generated from renewable sources at our
production sites, as well as improved energy efficiency
measures, enabled production-related CO2 emissions
per vehicle produced to be forced down by another 13.6 %
year-on-year to 0.57 tonnes during the period under re-
port (2014: 0.66 tonnes). At 2.24 m³ per vehicle produced
,
Fleet carbon emissions again reduced
The development of sustainable products and services
is an important aspect of the BMW Group’s business
model. CO
2
emissions levels are continually being
re-
duced by incorporating Efficient Dynamics
technolo-
gies in all of the Group’s vehicles. The scope of electri-
fication
within the fleet was further increased in 2015.
These measures form the basis for complying with
le-
gally stipulated CO2 and fuel consumption limits moving
forward. Between 1995 and 2015, the average amount of
CO2 emitted by the Group’s three brands sold in Europe
fell by 39.5 %. In 2015, the BMW Group’s fleet of new
vehicles sold in Europe (EU-28) consumed an average
of 4.7 litres of diesel per 100 km and 5.7 litres of petrol
respectively. CO2 emissions averaged 127 grams per km.
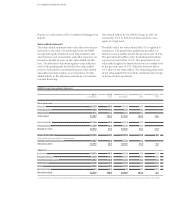
Clean production
The efficient use of resources is an important aspect of
running the business on a sustainable basis. When
applied to all production-related processes, resource
efficiency helps protect the environment and minimise
costs. Since 2006, the consumption of resources and
emissions per vehicle produced has been reduced by an
average of 48.1 %. The individual figures are as follows:
water consumption was slightly higher than one year
earlier, largely due to increased cooling requirements
caused by the hot summer in Germany (2014: 2.18 m³;
+ 2.8 %). At 0.45 m³, the volume of process wastewater
per vehicle produced fell by 4.3 % (2014: 0.47 m³). The
volume of non-recyclable production waste was further
reduced to 4.00 kg per vehicle produced in 2015 (2014:
4.93 kg; – 18.9 %). Solvent emissions were successfully
curtailed by 5.4 % to 1.22 kg per vehicle produced during
2015 (2014: 1.29 kg).
Sustainability along the entire value-added chain
Sustainability criteria are not only a vital aspect of in-
house production, they also play a major role in the
selection and assessment of suppliers as well as in the
field of transport logistics. The active management
of sustainability risks along the supply chain mitigates
compliance and image risks. With this in mind, the
BMW Group has integrated a comprehensive system of
sustainability management in its purchasing processes.
The amount of energy required for transportation world-
wide has continued to rise sharply in recent years. In
order to keep CO2 emissions to an absolute minimum,
the principle “production follows the market” is applied.
In addition, the proportion of CO
2
-efficient modes of
transport is being increased continually.
In the year under report, for instance, the proportion
of goods transported by air freight was significantly re-
duced. At 63.1 %, the proportion of new vehicles leaving
BMW Group plants by rail was maintained at a high
level (2014: 63.3 %).
Competitive thanks to sustainable human
resources policies
In 2015, the BMW Group reinforced its position as one
of the most attractive employers in the world. The
prominent role played in the field of sustainability helps
employees identify with the business and its products.
This strong sense of identification is one of the factors
contributing to the low attrition rate within the BMW
Group, in turn helping to keep personnel recruitment
expenses on the low side.
Social engagement
The BMW Group expended a total of € 39.1 million
(2014: € 34.5 million) for social engagement in 2015, in-
cluding
€ 17.1 million (2014: € 10.2 million) in the form
of donations. The sharp increase in overall expenditure
for social engagement compared to 2014 mainly reflects