BMW 2015 Annual Report Download - page 123
Download and view the complete annual report
Please find page 123 of the 2015 BMW annual report below. You can navigate through the pages in the report by either clicking on the pages listed below, or by using the keyword search tool below to find specific information within the annual report.-
 1
1 -
2
-
3
-
4
-
5
-
6
-
7
-
8
-
9
-
10
-
11
-
12
-
13
-
14
-
15
-
16
-
17
-
18
-
19
-
20
-
21
-
22
-
23
-
24
-
25
-
26
-
27
-
28
-
29
-
30
-
31
-
32
-
33
-
34
-
35
-
36
-
37
-
38
-
39
-
40
-
41
-
42
-
43
-
44
-
45
-
46
-
47
-
48
-
49
-
50
-
51
-
52
-
53
-
54
-
55
-
56
-
57
-
58
-
59
-
60
-
61
-
62
-
63
-
64
-
65
-
66
-
67
-
68
-
69
-
70
-
71
-
72
-
73
-
74
-
75
-
76
-
77
-
78
-
79
-
80
-
81
-
82
-
83
-
84
-
85
-
86
-
87
-
88
-
89
-
90
-
91
-
92
-
93
-
94
-
95
-
96
-
97
-
98
-
99
-
100
-
101
-
102
-
103
-
104
-
105
-
106
-
107
-
108
-
109
-
110
-
111
-
112
-
 113
113 -
 114
114 -
 115
115 -
 116
116 -
 117
117 -
 118
118 -
 119
119 -
 120
120 -
 121
121 -
 122
122 -
 123
123 -
 124
124 -
 125
125 -
 126
126 -
 127
127 -
 128
128 -
 129
129 -
 130
130 -
 131
131 -
 132
132 -
 133
133 -
134
-
135
-
136
-
137
-
138
-
139
-
140
-
141
-
142
-
143
-
144
-
145
-
146
-
147
-
148
-
149
-
150
-
151
-
152
-
153
-
154
-
155
-
156
-
157
-
158
-
159
-
160
-
161
-
162
-
163
-
164
-
165
-
166
-
167
-
168
-
169
-
170
-
171
-
172
-
173
-
174
-
175
-
176
-
177
-
178
-
179
-
180
-
181
-
182
-
183
-
184
-
185
-
186
-
187
-
188
-
189
-
190
-
191
-
192
-
193
-
194
-
195
-
196
-
197
-
198
-
199
-
200
-
201
-
202
-
203
-
204
-
205
-
206
-
207
-
208
-
209
-
210
 |
 |

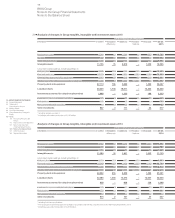
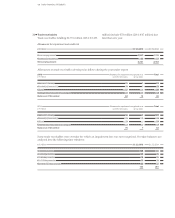
123 GROUP FINANCIAL STATEMENTS
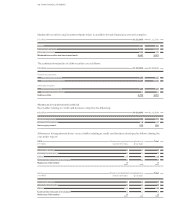
Depreciation and amortisation Carrying amount
1. 1. 20151 Trans- Current Dis- 31. 12. 31. 12. 31. 12.
lation year posals 2015 2015 2014
differ-
ences
3,888 – 1,166 883 4,171 6,351 5,453 Development costs
5 – – – 5 364 364 Goodwill
763 11 175 152 797 657 682 Other intangible assets
4,656 11 1,341 1,035 4,973 7,372 6,499 Intangible assets
Land, titles to land, buildings, including buildings on
4,181 77 319 62 4,515 5,915 5,625 third party land
23,841 390 2,795 1,150 25,876 9,593 8,930 Plant and machinery
1,902 43 204 208 1,941 660 613 Other facilities, factory and office equipment
6 – – – 6 1,5912 2,014 Advance payments made and construction in progress
29,930 510 3,318 1,420 32,338 17,759 17,182 Property, plant and equipment
6,804 238 3,536 3,277 7,301 34,965 30,165 Leased products
– – – – – 2,233 1,088
Investments accounted for using the equity method
62 2 12 – 76 157 164 Investments in non-consolidated subsidiaries
398 – 13 – 411 245 244 Participations
– – 2 – 2 26 – Non-current marketable securities
460 2 27 – 489 428 408 Other investments
Depreciation and amortisation Carrying amount
1. 1. 20141 Trans- Current
Changes
Dis- 31. 12. 31. 12. 31. 12.
lation year
not effect-
posals 2014 2014 20132
differ-
ing
net
ences income
4,645 – 1,068 – 1,825 3,888 5,453 5,022 Development costs
5 – – – – 5 364 369 Goodwill
665 10 178 – 92 761 682 788 Other intangible assets
5,315 10 1,246 – 1,917 4,654 6,499 6,179 Intangible assets
Land, titles to land, buildings, including buildings on
3,849 85 282 – 38 4,178 5,625 4,890 third party land
22,071 431 2,461 – 1,129 23,834 8,930 6,771 Plant and machinery
1,809 52 181 – 145 1,897 613 536 Other facilities, factory and office equipment
– – – – – – 2,0143 2,971 Advance payments made and construction in progress
27,729 568 2,924 – 1,312 29,909 17,182 15,168 Property, plant and equipment
6,572 293 3,401 – 3,462 6,804 30,165 25,914 Leased products
– – – – – – 1,088 638
Investments accounted for using the equity method
76 1 1 – 16 62 164 166 Investments in non-consolidated subsidiaries
188 – 152 57 – 397 244 387 Participations
– – – – – – – – Non-current marketable securities
264 1 153 57 16 459 408 553 Other investments