BMW 2015 Annual Report Download - page 50
Download and view the complete annual report
Please find page 50 of the 2015 BMW annual report below. You can navigate through the pages in the report by either clicking on the pages listed below, or by using the keyword search tool below to find specific information within the annual report.-
 1
1 -
2
-
3
-
4
-
5
-
6
-
7
-
8
-
9
-
10
-
11
-
12
-
13
-
14
-
15
-
16
-
17
-
18
-
19
-
20
-
21
-
22
-
23
-
24
-
25
-
26
-
27
-
28
-
29
-
30
-
31
-
32
-
33
-
34
-
35
-
36
-
37
-
38
-
39
-
 40
40 -
 41
41 -
 42
42 -
 43
43 -
 44
44 -
 45
45 -
 46
46 -
 47
47 -
 48
48 -
 49
49 -
 50
50 -
 51
51 -
 52
52 -
 53
53 -
 54
54 -
 55
55 -
 56
56 -
 57
57 -
 58
58 -
 59
59 -
 60
60 -
61
-
62
-
63
-
64
-
65
-
66
-
67
-
68
-
69
-
70
-
71
-
72
-
73
-
74
-
75
-
76
-
77
-
78
-
79
-
80
-
81
-
82
-
83
-
84
-
85
-
86
-
87
-
88
-
89
-
90
-
91
-
92
-
93
-
94
-
95
-
96
-
97
-
98
-
99
-
100
-
101
-
102
-
103
-
104
-
105
-
106
-
107
-
108
-
109
-
110
-
111
-
112
-
113
-
114
-
115
-
116
-
117
-
118
-
119
-
120
-
121
-
122
-
123
-
124
-
125
-
126
-
127
-
128
-
129
-
130
-
131
-
132
-
133
-
134
-
135
-
136
-
137
-
138
-
139
-
140
-
141
-
142
-
143
-
144
-
145
-
146
-
147
-
148
-
149
-
150
-
151
-
152
-
153
-
154
-
155
-
156
-
157
-
158
-
159
-
160
-
161
-
162
-
163
-
164
-
165
-
166
-
167
-
168
-
169
-
170
-
171
-
172
-
173
-
174
-
175
-
176
-
177
-
178
-
179
-
180
-
181
-
182
-
183
-
184
-
185
-
186
-
187
-
188
-
189
-
190
-
191
-
192
-
193
-
194
-
195
-
196
-
197
-
198
-
199
-
200
-
201
-
202
-
203
-
204
-
205
-
206
-
207
-
208
-
209
-
210
 |
 |

50
18 COMBINED MANAGEMENT REPORT
18
General Information on the
BMW
Group
18 Business Model
20 Management System
23 Report on Economic Position
23 General and Sector-specific
Environment
27 Overall Assessment by Management
27
Financial and Non-financial
Performance Indicators
29 Review of Operations
49 Results of Operations, Financial
Position and Net Assets
59 Comments on Financial Statements
of BMW AG
62 Events after the End of the
Reporting Period
63 Report on Outlook, Risks and
Opportunities
63 Outlook
68 Report on Risks and Opportunities
81 Internal Control System and Risk
Management System Relevant for
the
Financial Reporting Process
83 Disclosures Relevant for Takeovers
and Explanatory Comments
87
BMW Stock and Capital Markets
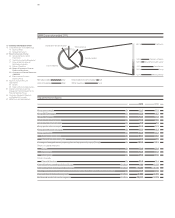
(2014: 20.7 %) and the Africa, Asia and Oceania region
for 31.1 % (2014: 32.5 %) of business.
External revenues in Germany edged up by 3.1 %. In
the Rest of Europe region and in the Americas region, ex-
ternal
revenues increased by 16.2 % and 29.4 %
respec-
tively. Good contributions to the increase in Europe were
made by Great Britain, France, Spain and Italy. Reve-
nues in the Africa, Asia and Oceania region grew 9.6 %
to € 28,648 million (2014: € 26,147 million). Particularly
in China and South Korea, revenues increased on the
back of higher sales volume figures and favourable cur-
rency factors.
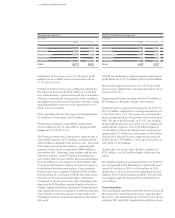
The Group’s cost of sales was 16.8 % higher year-on-
year, due to sales volume and currency factors. This
line item mainly comprises manufacturing costs (2015:
€ 43,685 million; 2014: € 38,253 million), the cost of
sales directly attributable to financial services (2015:
€ 17,407 million; 2014: € 14,716 million) and research and
development expenses (2015: € 4,271 million; 2014:
€ 4,135 million).
Gross profit improved by 6.6 % to € 18,132 million, re-
sulting in a gross profit margin of 19.7 % (2014: 21.2 %).
The Automotive segment recorded a gross profit mar-
gin of 17.7 % (2014: 18.6 %), while that of the Motor-
cycles segment rose from 18.7 % to 22.5 %. In the Finan-
cial Services segment, the gross profit margin came in
at 13.3 % (2014: 13.7 %).
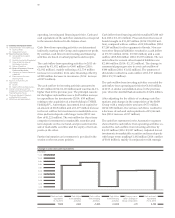
Compared to the previous year, research and develop-
ment expenses increased by € 136 million to € 4,271 mil-
lion. As a percentage of revenues, the research and de-
velopment ratio fell by 0.5 percentage points to 4.6 %.
Research and development expenses include amortisa-
tion
of capitalised development costs amounting to
€ 1,166 million (2014: € 1,068 million). Total research and
development expenditure – comprising research costs,
non-capitalised development costs and capitalised
de-
velopment costs (excluding systematic amortisation
thereon) – amounted to € 5,169 million (2014: € 4,566 mil-
lion). The research and development expenditure ratio
was therefore 5.6 % (2014: 5.7 %). The proportion of
development costs recognised as assets was 39.9 % (2014:
32.8 %).
Compared to the previous year, selling and
administra-
tive expenses increased by € 741 million to € 8,633 million
.
Overall, selling and administrative expenses were
equivalent
to 9.4 % (2014: 9.8 %) of revenues. Adminis-
trative expenses increased due to a number of factors,
including the increased size of the workforce and
higher expenses for new IT projects. Depreciation and
amortisation on property, plant and equipment and
intangible assets recorded in cost of sales and in selling
and administrative expenses amounted to € 4,659 mil-
lion (2014: € 4,170 million).
The net positive amount from other operating income
and expenses improved from € 5 million to € 94 mil-
lion,
mainly reflecting gains on the sale of marketable
securities.
Profit before financial result (EBIT) amounted to
€ 9,593 million
(2014: € 9,118 million).
The financial result for the twelve-month period was a
net negative amount of € 369 million, an improvement
of € 42 million compared to the previous year. The
result from equity-accounted investments, comprising
the
Group’s share of the results of the joint ventures
BMW Brilliance Automotive Ltd., Shenyang, DriveNow
GmbH & Co. KG, Munich, and DriveNow Verwaltungs
GmbH, Munich, fell by € 137 million to € 518 million.
The net interest expense also deteriorated year-on-year,
rising by € 114 million to € 433 million. This increase
was partly attributable to higher net interest expenses
from defined benefit pension plans. Other financial
result in 2015 was a negative amount of € 454 million,
mostly arising in connection with the fair value meas-
urement of currency and commodity derivatives.
Com-
pared to the previous year, other financial result im-
proved by € 293 million, mainly thanks to the lower
negative impact of currency derivatives. In the previous
year, impairment losses recognised on other investments,
most notably on the investment in SGL Carbon SE,
Wiesbaden, had also negatively impacted other finan-
cial result.
Profit before tax increased to € 9,224 million (2014:
€ 8,707 million). The pre-tax return on sales was 10.0 %
(2014: 10.8 %).
Income tax expense amounted to € 2,828 million
(2014: € 2,890 million), corresponding to an effective
tax rate of 30.7 % (2014: 33.2 %). The lower income tax
expense for the twelve-month period was partly due
to the changed regional earnings mix as well as inter-
group pricing issues.
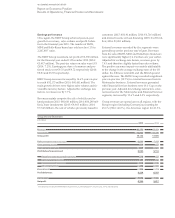
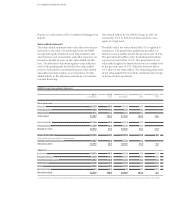
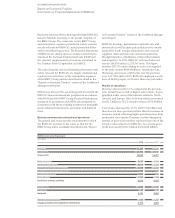
Earnings performance by segment
Revenues of the Automotive segment grew by 13.8 % to
€ 85,536 million on the back of higher sales volume
and the positive currency impact. Adjusted for exchange