BMW 2015 Annual Report Download - page 51
Download and view the complete annual report
Please find page 51 of the 2015 BMW annual report below. You can navigate through the pages in the report by either clicking on the pages listed below, or by using the keyword search tool below to find specific information within the annual report.-
 1
1 -
2
-
3
-
4
-
5
-
6
-
7
-
8
-
9
-
10
-
11
-
12
-
13
-
14
-
15
-
16
-
17
-
18
-
19
-
20
-
21
-
22
-
23
-
24
-
25
-
26
-
27
-
28
-
29
-
30
-
31
-
32
-
33
-
34
-
35
-
36
-
37
-
38
-
39
-
40
-
 41
41 -
 42
42 -
 43
43 -
 44
44 -
 45
45 -
 46
46 -
 47
47 -
 48
48 -
 49
49 -
 50
50 -
 51
51 -
 52
52 -
 53
53 -
 54
54 -
 55
55 -
 56
56 -
 57
57 -
 58
58 -
 59
59 -
 60
60 -
 61
61 -
62
-
63
-
64
-
65
-
66
-
67
-
68
-
69
-
70
-
71
-
72
-
73
-
74
-
75
-
76
-
77
-
78
-
79
-
80
-
81
-
82
-
83
-
84
-
85
-
86
-
87
-
88
-
89
-
90
-
91
-
92
-
93
-
94
-
95
-
96
-
97
-
98
-
99
-
100
-
101
-
102
-
103
-
104
-
105
-
106
-
107
-
108
-
109
-
110
-
111
-
112
-
113
-
114
-
115
-
116
-
117
-
118
-
119
-
120
-
121
-
122
-
123
-
124
-
125
-
126
-
127
-
128
-
129
-
130
-
131
-
132
-
133
-
134
-
135
-
136
-
137
-
138
-
139
-
140
-
141
-
142
-
143
-
144
-
145
-
146
-
147
-
148
-
149
-
150
-
151
-
152
-
153
-
154
-
155
-
156
-
157
-
158
-
159
-
160
-
161
-
162
-
163
-
164
-
165
-
166
-
167
-
168
-
169
-
170
-
171
-
172
-
173
-
174
-
175
-
176
-
177
-
178
-
179
-
180
-
181
-
182
-
183
-
184
-
185
-
186
-
187
-
188
-
189
-
190
-
191
-
192
-
193
-
194
-
195
-
196
-
197
-
198
-
199
-
200
-
201
-
202
-
203
-
204
-
205
-
206
-
207
-
208
-
209
-
210
 |
 |

51 COMBINED MANAGEMENT REPORT
rate factors, the increase was 6.3 %. The gross profit
margin was at a similar level to the
previous year at
17.7 % (2014: 18.6 %).
Compared to the previous year, selling and administra-
tive expenses increased by € 574 million to € 7,219
mil-
lion. Administrative expenses increased due to a number
of factors, including the increased size of the workforce
and higher expenses for new IT projects. Overall, selling
and administrative expenses were equivalent to 8.4 %
(2014: 8.8 %) of revenues.
Other operating income and expenses deteriorated by
€ 19 million to a net expense of € 82 million.
Profit before financial result (EBIT) amounted to
€ 7,836 million (2014: € 7,244 million), giving an EBIT
margin of 9.2 % (2014: 9.6 %).
The financial result of the Automotive segment was a
net negative amount of € 313 million, an improvement
of € 45 million compared to the previous year. The result
from equity-accounted investments, comprising the
segment’s share of the results of the BMW Brilliance
Automotive Ltd., Shenyang, joint venture and the two
DriveNow entities, was € 137 million lower than one
year earlier. The interest result for the year deteriorated
by € 146 million to a net expense of € 435 million. This
was partly attributable to higher net interest expenses
from defined benefit pension plans. Other financial
result in 2015 was a negative amount of € 396 million,
mostly arising in connection with the fair value meas-
urement of currency and commodities derivatives.
Compared to the previous year, other financial result
improved by € 328 million, mainly thanks to the lower
negative impact of currency derivatives. In the previous
year, impairment losses recognised on other investments,
most notably on the investment in SGL Carbon SE,
Wiesbaden, had also negatively impacted other finan-
cial result.
Overall, the Automotive segment reports a solid rise in
profit before tax to € 7,523 million (2014: € 6,886 million).
Motorcycles segment revenues were 18.5 % up on the
previous year. Adjusted for exchange rate factors, the in-
crease was 15.4 %.
Segment profit before tax improved by € 72 million to
€ 179 million on the back of higher sales volume.
Financial Services segment revenues grew by 15.2 % to
€ 23,739 million. Adjusted for exchange rate factors, rev-
enues went up by 7.6 %. The segment’s revenue perfor-
mance primarily reflects the growth of its contract
port-
folio. The gross profit margin, at 13.3 %, was roughly
in line with the previous year (2014: 13.7 %). Selling and
administrative expenses were € 129 million higher at
€ 1,164 million. Other operating income and expenses
improved by € 17 million to a net expense of € 8 million.
Overall, the Financial Services segment reports profit
before tax of € 1,975 million, 14.6 % up on the previous
year (2014: € 1,723 million).
Profit before tax in the Other Entities segment, at
€ 211 million, was € 57 million higher than one year
earlier.
The negative impact on earnings at the level of profit be-
fore tax reported in the Eliminations column increased
from € 163 million in 2014 to € 664 million in 2015,
mainly due to an increase in new leasing business and
changes in the leased products portfolio. The previous
year’s figures had also benefited from elimination re-
versal effects.
Financial position
The consolidated cash flow statements for the Group and
the Automotive and Financial Services segments show
the sources and applications of cash flows for the finan-
cial years 2015 and 2014, classified into cash flows from
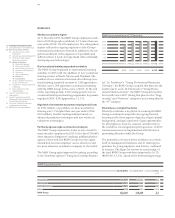
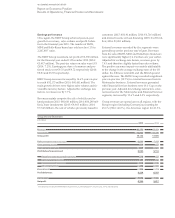
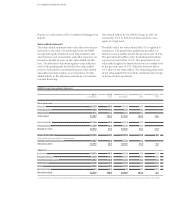
Revenues by segment
in € million
2015 2014
Automotive 85,536 75,173
Motorcycles 1,990 1,679
Financial Services 23,739 20,599
Other Entities 7 7
Eliminations – 19,097 – 17,057
Group 92,175 80,401
Profit / loss before tax by segment
in € million
2015 2014
Automotive 7,523 6,886
Motorcycles 179 107
Financial Services 1,975 1,723
Other Entities 211 154
Eliminations – 664 – 163
Group 9,224 8,707