BMW 2015 Annual Report Download - page 57
Download and view the complete annual report
Please find page 57 of the 2015 BMW annual report below. You can navigate through the pages in the report by either clicking on the pages listed below, or by using the keyword search tool below to find specific information within the annual report.-
 1
1 -
2
-
3
-
4
-
5
-
6
-
7
-
8
-
9
-
10
-
11
-
12
-
13
-
14
-
15
-
16
-
17
-
18
-
19
-
20
-
21
-
22
-
23
-
24
-
25
-
26
-
27
-
28
-
29
-
30
-
31
-
32
-
33
-
34
-
35
-
36
-
37
-
38
-
39
-
40
-
41
-
42
-
43
-
44
-
45
-
46
-
 47
47 -
 48
48 -
 49
49 -
 50
50 -
 51
51 -
 52
52 -
 53
53 -
 54
54 -
 55
55 -
 56
56 -
 57
57 -
 58
58 -
 59
59 -
 60
60 -
 61
61 -
 62
62 -
 63
63 -
 64
64 -
 65
65 -
 66
66 -
 67
67 -
68
-
69
-
70
-
71
-
72
-
73
-
74
-
75
-
76
-
77
-
78
-
79
-
80
-
81
-
82
-
83
-
84
-
85
-
86
-
87
-
88
-
89
-
90
-
91
-
92
-
93
-
94
-
95
-
96
-
97
-
98
-
99
-
100
-
101
-
102
-
103
-
104
-
105
-
106
-
107
-
108
-
109
-
110
-
111
-
112
-
113
-
114
-
115
-
116
-
117
-
118
-
119
-
120
-
121
-
122
-
123
-
124
-
125
-
126
-
127
-
128
-
129
-
130
-
131
-
132
-
133
-
134
-
135
-
136
-
137
-
138
-
139
-
140
-
141
-
142
-
143
-
144
-
145
-
146
-
147
-
148
-
149
-
150
-
151
-
152
-
153
-
154
-
155
-
156
-
157
-
158
-
159
-
160
-
161
-
162
-
163
-
164
-
165
-
166
-
167
-
168
-
169
-
170
-
171
-
172
-
173
-
174
-
175
-
176
-
177
-
178
-
179
-
180
-
181
-
182
-
183
-
184
-
185
-
186
-
187
-
188
-
189
-
190
-
191
-
192
-
193
-
194
-
195
-
196
-
197
-
198
-
199
-
200
-
201
-
202
-
203
-
204
-
205
-
206
-
207
-
208
-
209
-
210
 |
 |
57 COMBINED MANAGEMENT REPORT
Report is a subsection of the Combined Management
Report.
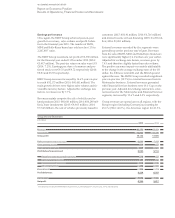
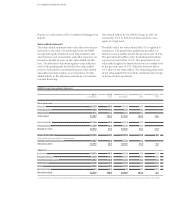
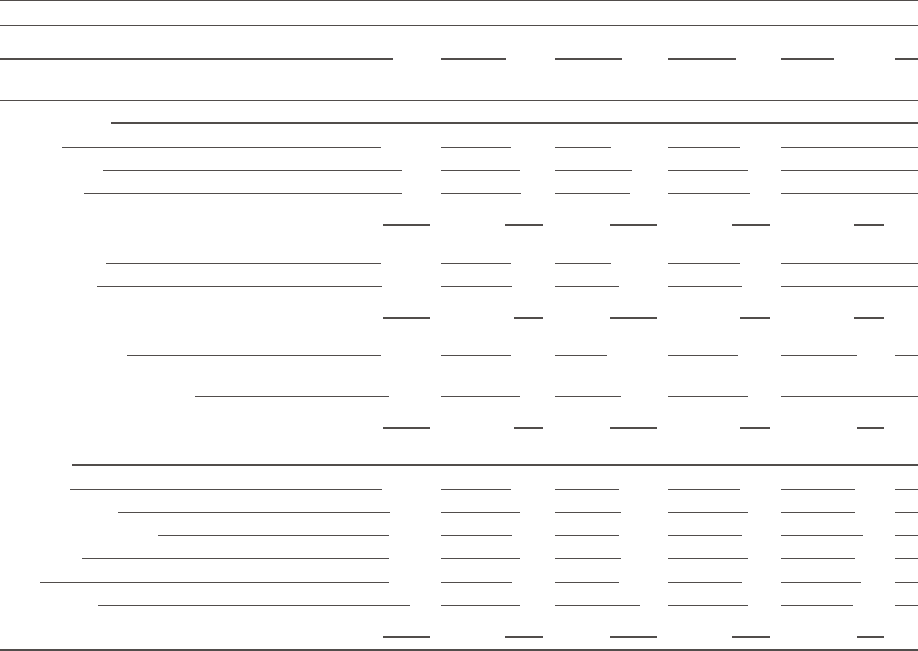
Value added statement
The value added statement shows the value of work per-
formed, less the value of work bought in by the BMW
Group during the financial year. Depreciation and
amortisation, cost of materials, and other expenses are
treated as bought-in costs in the value added calcula-
tion. The allocation statement applies value added to
each of the participants involved in the value added
process. It should be noted that the gross value added
amount treats depreciation as a component of value
added which, in the allocation statement, is treated as
internal financing.
Net valued added by the BMW Group in 2015 in-
creased by 9.2 % to € 22,524 million and was once
again at a high level.
The bulk of the net value added (48.3 %) is applied to
employees. The proportion applied to providers of
finance was at a similar level to the previous year (8.5 %).
The government / public sector (including deferred tax
expense) accounted for 14.8 %. The proportion of net
value added applied to shareholders was at a similar level
to the previous year (9.3 %). Minority interests take a
0.1 % share of net value added. The remaining proportion
of net value added (19.0 %) will be retained in the Group
to finance future operations.
BMW Group value added statement
2015 2015 2014 2014 Change
in € million in % in € million in % in %
Work performed
Revenues 92,175 98.8 80,401 98.7
Financial income 200 0.2 156 0.2
Other income 914 1.0 877 1.1
Total output 93,289 100.0 81,434 100.0 14.6
Cost of materials* 51,145 54.8 44,078 54.1
Other expenses 11,398 12.2 9,012 11.1
Bought-in costs 62,543 67.0 53,090 65.2 17.8
Gross value added 30,746 33.0 28,344 34.8 8 . 5
Depreciation and amortisation of total tangible,
intangible and investment assets 8,222 8.8 7,724 9.5
Net value added 22,524 24.2 20,620 25.3 9 . 2
Applied to
Employees 10,870 48.3 9,764 47.4 11.3
Providers of finance 1,918 8.5 1,733 8.4 10.7
Government / public sector 3,340 14.8 3,306 16.0 1.0
Shareholders 2,102 9.3 1,904 9.2 10.4
Group 4,267 19.0 3,894 18.9 9.6
Minority interest 27 0.1 19 0.1 42.1
Net value added 22,524 100.0 20,620 100.0 9 . 2
* Cost of materials comprises all primary material costs incurred for vehicle production plus ancillary material costs (such as customs duties, insurance premiums and freight).