Advance Auto Parts 2009 Annual Report Download - page 96
Download and view the complete annual report
Please find page 96 of the 2009 Advance Auto Parts annual report below. You can navigate through the pages in the report by either clicking on the pages listed below, or by using the keyword search tool below to find specific information within the annual report.-
 1
1 -
2
-
3
-
4
-
5
-
6
-
7
-
8
-
9
-
10
-
11
-
12
-
13
-
14
-
15
-
16
-
17
-
18
-
19
-
20
-
21
-
22
-
23
-
24
-
25
-
26
-
27
-
28
-
29
-
30
-
31
-
32
-
33
-
34
-
35
-
36
-
37
-
38
-
39
-
40
-
41
-
42
-
43
-
44
-
45
-
46
-
47
-
48
-
49
-
50
-
51
-
52
-
53
-
54
-
55
-
56
-
57
-
58
-
59
-
60
-
61
-
62
-
63
-
64
-
65
-
66
-
67
-
68
-
69
-
70
-
71
-
72
-
73
-
74
-
75
-
76
-
77
-
78
-
79
-
80
-
81
-
82
-
83
-
84
-
85
-
 86
86 -
 87
87 -
 88
88 -
 89
89 -
 90
90 -
 91
91 -
 92
92 -
 93
93 -
 94
94 -
 95
95 -
 96
96 -
 97
97 -
 98
98 -
 99
99 -
 100
100 -
 101
101 -
 102
102 -
 103
103 -
 104
104 -
 105
105 -
 106
106 -
107
-
108
-
109
-
110
-
111
-
112
 |
 |

ADVANCE AUTO PARTS, INC. AND SUBSIDIARIES
NOTES TO THE CONSOLIDATED FINANCIAL STATEMENTS
January 2, 2010, January 3, 2009 and December 29, 2007
(in thousands, except per share data)
.
F-43
(1) For Fiscal 2009, eliminations represent net sales of $3,764 from AAP to AI and $4,505 from AI to AAP.
(2) Sales by product group are not available for the AI segment.
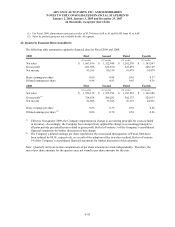
22. Quarterly Financial Data (unaudited):
The following table summarizes quarterly financial data for Fiscal 2009 and 2008:
2009 First Second Third Fourth
(16 weeks) (12 weeks) (12 weeks) (12 weeks)
Net sales 1,683,636$ 1,322,844$ 1,262,576$ 1,143,567$
Gross profit 821,988 652,650 621,459 548,129
Net income 93,585 80,330 61,979 34,479
Basic earnings per share 0.99 0.84 0.65 0.37
Diluted earnings per share 0.98 0.83 0.65 0.36
2008 First Second Third Fourth
(16 weeks) (12 weeks) (12 weeks) (13 weeks)
Net sales 1,526,132$ 1,235,783$ 1,187,952$ 1,192,388$
Gross profit
(1)
724,854 586,282 562,175 525,813
Net income 82,086 75,386 56,155 24,411
Basic earnings per share 0.86 0.79 0.59 0.26
Diluted earnings per share
(2)
0.86 0.78 0.58 0.26
(1) Effective first quarter 2009, the Company implemented a change in accounting principle for costs included
in inventory. Accordingly, the Company has retrospectively applied the change in accounting principle to
all prior periods presented herein related to gross profit. Refer to Footnote 3 of the Company’s consolidated
financial statements for further discussion of this change.
(2) The Company’s diluted earnings per share reported for the second and third quarters of Fiscal 2008 have
been reduced by $0.01, respectively, as a result of the adoption of the two-class method. Refer to Footnote
14 of the Company’s consolidated financial statements for further discussion of this adoption.
Note: Quarterly and year-to-date computations of per share amounts are made independently. Therefore, the
sum of per share amounts for the quarters may not round to per share amounts for the year.