Advance Auto Parts 2009 Annual Report Download - page 81
Download and view the complete annual report
Please find page 81 of the 2009 Advance Auto Parts annual report below. You can navigate through the pages in the report by either clicking on the pages listed below, or by using the keyword search tool below to find specific information within the annual report.-
 1
1 -
2
-
3
-
4
-
5
-
6
-
7
-
8
-
9
-
10
-
11
-
12
-
13
-
14
-
15
-
16
-
17
-
18
-
19
-
20
-
21
-
22
-
23
-
24
-
25
-
26
-
27
-
28
-
29
-
30
-
31
-
32
-
33
-
34
-
35
-
36
-
37
-
38
-
39
-
40
-
41
-
42
-
43
-
44
-
45
-
46
-
47
-
48
-
49
-
50
-
51
-
52
-
53
-
54
-
55
-
56
-
57
-
58
-
59
-
60
-
61
-
62
-
63
-
64
-
65
-
66
-
67
-
68
-
69
-
70
-
 71
71 -
 72
72 -
 73
73 -
 74
74 -
 75
75 -
 76
76 -
 77
77 -
 78
78 -
 79
79 -
 80
80 -
 81
81 -
 82
82 -
 83
83 -
 84
84 -
 85
85 -
 86
86 -
 87
87 -
 88
88 -
 89
89 -
 90
90 -
 91
91 -
92
-
93
-
94
-
95
-
96
-
97
-
98
-
99
-
100
-
101
-
102
-
103
-
104
-
105
-
106
-
107
-
108
-
109
-
110
-
111
-
112
 |
 |

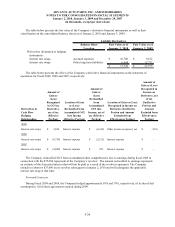
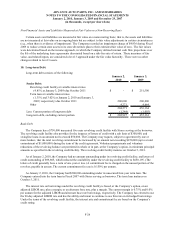
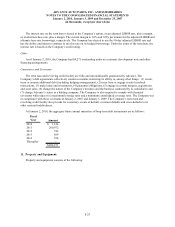
ADVANCE AUTO PARTS, INC. AND SUBSIDIARIES
NOTES TO THE CONSOLIDATED FINANCIAL STATEMENTS
January 2, 2010, January 3, 2009 and December 29, 2007
(in thousands, except per share data)
.
F-28
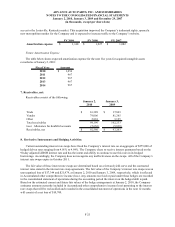
Original
Useful Lives
January 2,
2010
January 3,
2009
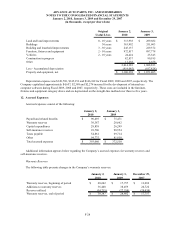
Land and land improvements 0 - 10 years 313,938$ 289,682$
Buildings 30 years 363,992 351,603
Building and leasehold improvements 3 - 30 years 245,137 229,372
Furniture, fixtures and equipment 2 - 10 years 972,817 897,778
Vehicles 2 - 10 years 24,424 25,545
Construction in progress 82,837 90,195
Other 11,238 4,658
2,014,383 1,888,833
Less - Accumulated depreciation (914,045) (817,428)
Property and equipment, net 1,100,338$ 1,071,405$
Depreciation expense was $149,769, $145,353 and $146,182 for Fiscal 2009, 2008 and 2007, respectively. The
Company capitalized approximately $4,657, $2,388 and $2,274 incurred for the development of internal use
computer software during Fiscal 2009, 2008 and 2007, respectively. These costs are included in the furniture,
fixtures and equipment category above and are depreciated on the straight-line method over three to five years.
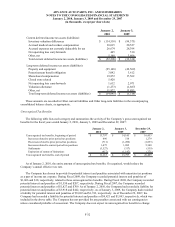
12. Accrued Expenses:
Accrued expenses consist of the following:
January 2, January 3,
2010 2009
Payroll and related benefits 90,493$ 75,471$
Warranty reserves 30,387 28,662
Capital expenditures 28,838 26,299
Self-insurance reserves 93,706 90,554
Taxes payable 54,861 69,714
Other 94,775 81,810
Total accrued expenses 393,060$ 372,510$
Additional information appears below regarding the Company’s accrued expenses for warranty reserves and
self-insurance reserves.
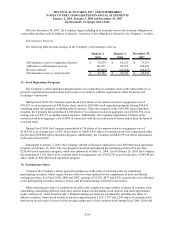
Warranty Reserves
The following table presents changes in the Company’s warranty reserves:
January 2, January 3, December 29,
2010 2009 2007
Warranty reserves, beginning of period 28,662$ 17,757$ 13,069$
Additions to warranty reserves 36,440 38,459 24,722
Reserves utilized (34,715) (27,554) (20,034)
Warranty reserves, end of period 30,387$ 28,662$ 17,757$