Advance Auto Parts 2009 Annual Report Download - page 58
Download and view the complete annual report
Please find page 58 of the 2009 Advance Auto Parts annual report below. You can navigate through the pages in the report by either clicking on the pages listed below, or by using the keyword search tool below to find specific information within the annual report.-
 1
1 -
2
-
3
-
4
-
5
-
6
-
7
-
8
-
9
-
10
-
11
-
12
-
13
-
14
-
15
-
16
-
17
-
18
-
19
-
20
-
21
-
22
-
23
-
24
-
25
-
26
-
27
-
28
-
29
-
30
-
31
-
32
-
33
-
34
-
35
-
36
-
37
-
38
-
39
-
40
-
41
-
42
-
43
-
44
-
45
-
46
-
47
-
 48
48 -
 49
49 -
 50
50 -
 51
51 -
 52
52 -
 53
53 -
 54
54 -
 55
55 -
 56
56 -
 57
57 -
 58
58 -
 59
59 -
 60
60 -
 61
61 -
 62
62 -
 63
63 -
 64
64 -
 65
65 -
 66
66 -
 67
67 -
 68
68 -
69
-
70
-
71
-
72
-
73
-
74
-
75
-
76
-
77
-
78
-
79
-
80
-
81
-
82
-
83
-
84
-
85
-
86
-
87
-
88
-
89
-
90
-
91
-
92
-
93
-
94
-
95
-
96
-
97
-
98
-
99
-
100
-
101
-
102
-
103
-
104
-
105
-
106
-
107
-
108
-
109
-
110
-
111
-
112
 |
 |

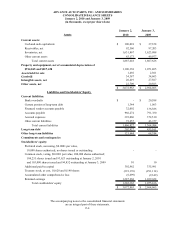
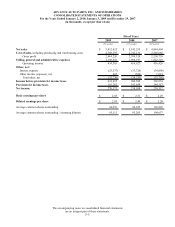
ADVANCE AUTO PARTS, INC. AND SUBSIDIARIES
CONSOLIDATED STATEMENTS OF OPERATIONS
For the Years Ended January 2, 2010, January 3, 2009 and December 29, 2007
(in thousands, except per share data)
The accompanying notes to consolidated financial statements
are an integral part of these statements.
F-5
2009 2008 2007
(52 weeks) (53 weeks) (52 weeks)
Net sales 5,412,623$ 5,142,255$ 4,844,404$
Cost of sales, including purchasing and warehousing costs 2,768,397 2,743,131 2,585,665
Gross profit 2,644,226 2,399,124 2,258,739
2,189,841 1,984,197 1,842,310
Operating income 454,385 414,927 416,429
Other, net:
Interest expense (23,337) (33,729) (34,809)
Other income (expense), net 607 (506) 1,014
Total other, net (22,730) (34,235) (33,795)
Income before provision for income taxes 431,655 380,692 382,634
Provision for income taxes 161,282 142,654 144,317
Net income 270,373 238,038 238,317
Basic earnings per share 2.85$ 2.51$ 2.29$
Diluted earnings per share 2.83$ 2.49$ 2.28$
Average common shares outstanding 94,459 94,655 103,826
Average common shares outstanding - assuming dilution 95,113 95,205 104,637
Fiscal Years
Selling, general and administrative expenses