Advance Auto Parts 2009 Annual Report Download - page 100
Download and view the complete annual report
Please find page 100 of the 2009 Advance Auto Parts annual report below. You can navigate through the pages in the report by either clicking on the pages listed below, or by using the keyword search tool below to find specific information within the annual report.-
 1
1 -
2
-
3
-
4
-
5
-
6
-
7
-
8
-
9
-
10
-
11
-
12
-
13
-
14
-
15
-
16
-
17
-
18
-
19
-
20
-
21
-
22
-
23
-
24
-
25
-
26
-
27
-
28
-
29
-
30
-
31
-
32
-
33
-
34
-
35
-
36
-
37
-
38
-
39
-
40
-
41
-
42
-
43
-
44
-
45
-
46
-
47
-
48
-
49
-
50
-
51
-
52
-
53
-
54
-
55
-
56
-
57
-
58
-
59
-
60
-
61
-
62
-
63
-
64
-
65
-
66
-
67
-
68
-
69
-
70
-
71
-
72
-
73
-
74
-
75
-
76
-
77
-
78
-
79
-
80
-
81
-
82
-
83
-
84
-
85
-
86
-
87
-
88
-
89
-
 90
90 -
 91
91 -
 92
92 -
 93
93 -
 94
94 -
 95
95 -
 96
96 -
 97
97 -
 98
98 -
 99
99 -
 100
100 -
 101
101 -
 102
102 -
 103
103 -
 104
104 -
 105
105 -
 106
106 -
 107
107 -
 108
108 -
 109
109 -
 110
110 -
111
-
112
 |
 |

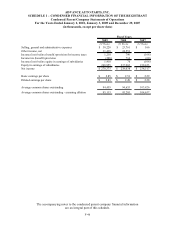
ADVANCE AUTO PARTS, INC.
SCHEDULE I – CONDENSED FINANCIAL INFORMATION OF THE REGISTRANT
Condensed Parent Company Statements of Cash Flows
For the Years Ended January 2, 2010, January 3, 2009 and December 29, 2007
(in thousands)
The accompanying notes to the condensed parent company financial information
are an integral part of this schedule.
F-47
2009 2008 2007
(52 Weeks) (53 Weeks) (52 Weeks)
Cash flows from operating activities:
Net income 270,373$ 238,038$ 238,317$
Adjustments to reconcile net income to net cash
provided (used in) by operations:
Equity in earnings of subsidiary (268,955) (237,962) (238,423)
Depreciation 29 30 -
Net decrease (increase) in working capital 585 85 (24)
Net cash provided by (used in) operating activities 2,032 191 (130)
Cash flows from investing activities:
Change in net intercompany with subsidiaries (2,032) (191) 130
Net cash (used in) provided by investing activities (2,032) (191) 130
Cash flows from financing activities: - - -
Net increase (decrease) in cash and cash equivalents - - -
Cash and cash equivalents, beginning of year 23 23 23
Cash and cash equivalents, end of yea
r
23$ 23$ 23$
Supplemental cash flow information:
Interest paid -$ -$ -$
Income taxes paid, net - - -
Noncash transactions:
Repurchase of Parent's common stock by Stores 100,062$ 219,429$ 282,910$
Retirement of common stock - - 211,225
Proceeds received by Stores from stock transactions under the
Parent's stock subscription plan and Stores' stock option plan 35,402 35,220 42,547
Cash dividends paid by Stores on behalf of Parent 22,803 23,181 25,152
Declared but unpaid cash dividends 5,587 5,657 5,957
Changes in other comprehensive income (loss) 2,650 (8,648) (4,173)
Adoption of unrecognized tax position guidance - - 2,275
Fiscal Years