Advance Auto Parts 2009 Annual Report Download - page 31
Download and view the complete annual report
Please find page 31 of the 2009 Advance Auto Parts annual report below. You can navigate through the pages in the report by either clicking on the pages listed below, or by using the keyword search tool below to find specific information within the annual report.-
 1
1 -
2
-
3
-
4
-
5
-
6
-
7
-
8
-
9
-
10
-
11
-
12
-
13
-
14
-
15
-
16
-
17
-
18
-
19
-
20
-
 21
21 -
 22
22 -
 23
23 -
 24
24 -
 25
25 -
 26
26 -
 27
27 -
 28
28 -
 29
29 -
 30
30 -
 31
31 -
 32
32 -
 33
33 -
 34
34 -
 35
35 -
 36
36 -
 37
37 -
 38
38 -
 39
39 -
 40
40 -
 41
41 -
42
-
43
-
44
-
45
-
46
-
47
-
48
-
49
-
50
-
51
-
52
-
53
-
54
-
55
-
56
-
57
-
58
-
59
-
60
-
61
-
62
-
63
-
64
-
65
-
66
-
67
-
68
-
69
-
70
-
71
-
72
-
73
-
74
-
75
-
76
-
77
-
78
-
79
-
80
-
81
-
82
-
83
-
84
-
85
-
86
-
87
-
88
-
89
-
90
-
91
-
92
-
93
-
94
-
95
-
96
-
97
-
98
-
99
-
100
-
101
-
102
-
103
-
104
-
105
-
106
-
107
-
108
-
109
-
110
-
111
-
112
 |
 |
18
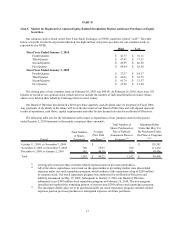
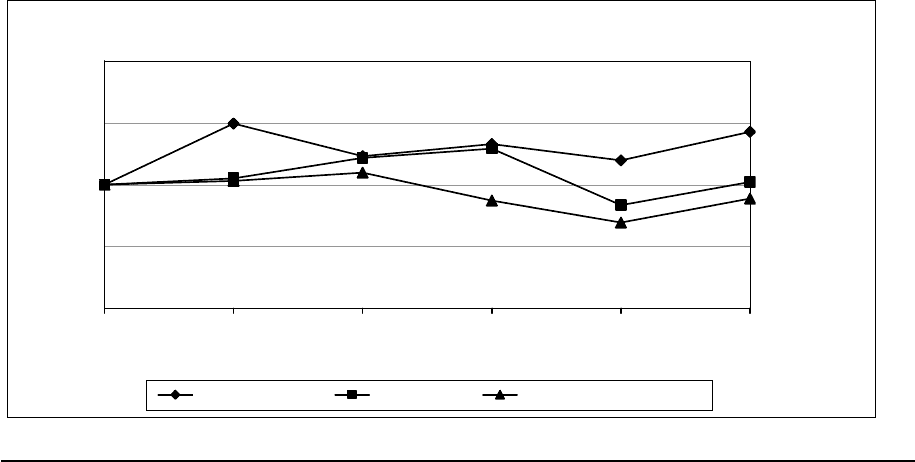
Stock Price Performance
The following graph shows a comparison of the cumulative total return on our common stock, the Standard &
Poor’s 500 Index and the Standard & Poor’s 500 Specialty Retail Index. The graph assumes that the value of an
investment in our common stock and in each such index was $100 on January 1, 2005, and that any dividends have
been reinvested. The comparison in the graph below is based solely on historical data and is not intended to forecast
the possible future performance of our common stock.
COMPARISON OF CUMULATIVE TOTAL RETURN AMONG
ADVANCE AUTO PARTS, INC., S&P 500 INDEX
AND S&P 500 SPECIALTY RETAIL INDEX
Company / Index Jan 1, 2005 Dec 31, 2005 Dec 30, 2006 Dec 29, 2007 Jan 3, 2009 Jan 2, 2010
Advance Auto Parts 100 149.24 122.91 132.77 119.57 142.62
S&P 500 Index 100 104.91 121.48 129.04 83.29 102.12
S&P 500 Specialty Retail Index 100 102.86 109.69 87.08 69.29 88.73
Comparison of Cumulative Five Year Total Return
$0
$50
$100
$150
$200
Jan 1, 2005 Dec 31, 2005 Dec 30, 2006 Dec 29, 2007 Jan 3, 2009 Jan 2, 2010
Advance Auto Parts S&P 500 Index S&P 500 Specialty Retail Index
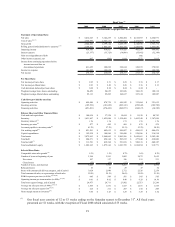
Item 6. Selected Consolidated Financial Data.
The following table sets forth our selected historical consolidated statement of operations, balance sheet and
other operating data. Included in this table are key metrics and operating results used to measure our financial
progress. The selected historical consolidated financial and other data at January 2, 2010 and January 3, 2009 and
for the three years ended January 2, 2010 have been derived from our audited consolidated financial statements and
the related notes included elsewhere in this report. The historical consolidated financial and other data at December
29, 2007, December 30, 2006 and December 31, 2005 and for the years ended December 30, 2006 and December
31, 2005 have been derived from our audited consolidated financial statements and the related notes that have not
been included in this report. You should read this data along with "Management's Discussion and Analysis of
Financial Condition and Results of Operations," and our consolidated financial statements and the related notes
included elsewhere in this report.