Advance Auto Parts 2009 Annual Report Download - page 33
Download and view the complete annual report
Please find page 33 of the 2009 Advance Auto Parts annual report below. You can navigate through the pages in the report by either clicking on the pages listed below, or by using the keyword search tool below to find specific information within the annual report.-
 1
1 -
2
-
3
-
4
-
5
-
6
-
7
-
8
-
9
-
10
-
11
-
12
-
13
-
14
-
15
-
16
-
17
-
18
-
19
-
20
-
21
-
22
-
 23
23 -
 24
24 -
 25
25 -
 26
26 -
 27
27 -
 28
28 -
 29
29 -
 30
30 -
 31
31 -
 32
32 -
 33
33 -
 34
34 -
 35
35 -
 36
36 -
 37
37 -
 38
38 -
 39
39 -
 40
40 -
 41
41 -
 42
42 -
 43
43 -
44
-
45
-
46
-
47
-
48
-
49
-
50
-
51
-
52
-
53
-
54
-
55
-
56
-
57
-
58
-
59
-
60
-
61
-
62
-
63
-
64
-
65
-
66
-
67
-
68
-
69
-
70
-
71
-
72
-
73
-
74
-
75
-
76
-
77
-
78
-
79
-
80
-
81
-
82
-
83
-
84
-
85
-
86
-
87
-
88
-
89
-
90
-
91
-
92
-
93
-
94
-
95
-
96
-
97
-
98
-
99
-
100
-
101
-
102
-
103
-
104
-
105
-
106
-
107
-
108
-
109
-
110
-
111
-
112
 |
 |
20
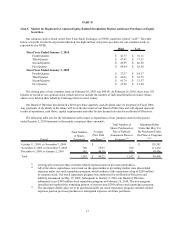
(2) Cost of sales includes a non-cash inventory adjustment of $37.5 million recorded in Fiscal 2008 due to a change in
our inventory management approach for slow moving inventory.
(3) Inventory turnover is calculated as cost of sales divided by the average of beginning and ending inventories.
(4) Inventory per store is calculated as ending inventory divided by ending store count.
(5) Accounts payable to inventory ratio is calculated as ending accounts payable divided by ending inventory. We
aggregate financed vendor accounts payable with accounts payable to calculate our accounts payable to inventory
ratio.
(6) Net working capital is calculated by subtracting current liabilities from current assets.
(7) Net debt includes total debt and bank overdrafts, less cash and cash equivalents.
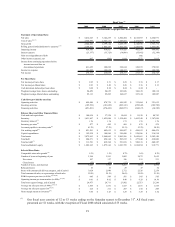
(8) Comparable store sales growth is calculated based on the change in net sales starting once a store has been
open for 13 complete accounting periods (each period represents four weeks). Relocations are included in
comparable store sales growth from the original date of opening. Beginning in Fiscal 2008, we include in
comparable store sales growth the net sales from stores operated Offshore and AI stores. The comparable
periods have been adjusted accordingly. Fiscal 2008 comparable store sales growth excludes sales from the
53rd week.
(9) Selling, general and administrative, or SG&A, expense per store is calculated as total SG&A expenses divided
by the average of beginning and ending store count. SG&A expenses per store for Fiscal 2009 were $638
excluding the $26.1 million impact of store divestitures. SG&A expenses per store for Fiscal 2008 were $590
excluding the impact of the 53rd week of Fiscal 2008 of approximately $28.4 million.
(10) The ending store count and/or store square footage used in the calculation of the 2005 ratios has been weighted
for the period of the AI acquisition.
(11) Operating income per team member is calculated as operating income divided by an average of the beginning
and ending number of team members. Operating income per team member for Fiscal 2009 was $9.94
excluding the $26.1 million impact of store divestitures. Excluding the operating income impact of the 53rd
week of Fiscal 2008 of approximately $15.8 million and a $37.5 million non-cash inventory adjustment,
operating income per team member in Fiscal 2008 was $9.49.
(12) Average net sales per store is calculated as net sales divided by the average of the beginning and the ending
number of stores for the respective period. Excluding the net sales impact of the 53rd week of Fiscal 2008 of
approximately $88.8 million, average net sales per store in Fiscal 2008 was $1,524.
(13) Average net sales per square foot is calculated as net sales divided by the average of the beginning and ending
total store square footage for the respective period. Excluding the net sales impact of the 53rd week of Fiscal
2008 of approximately $88.8 million, average net sales per square foot in Fiscal 2008 was $208. This measure
is presented in whole dollars.
(14) Gross margin return on inventory is calculated as gross profit divided by an average of beginning and ending
inventory, net of accounts payable and financed vendor accounts payable. Excluding the gross profit impact of the
53rd week of Fiscal 2008 of approximately $44.0 million and a $37.5 million non-cash inventory adjustment, gross
margin return on inventory in Fiscal 2008 was $3.37.
(15) Effective first quarter 2009, we implemented a change in accounting principle for costs included in inventory.
Accordingly, we have retrospectively applied the change in accounting principle to all prior periods presented
herein related to cost of sales and SG&A.
Item 7. Management's Discussion and Analysis of Financial Condition and Results of Operations.
The following discussion and analysis of financial condition and results of operations should be read in
conjunction with "Selected Consolidated Financial Data," our consolidated historical financial statements and the
notes to those statements that appear elsewhere in this report. Our discussion contains forward-looking statements
based upon current expectations that involve risks and uncertainties, such as our plans, objectives, expectations and
intentions. Actual results and the timing of events could differ materially from those anticipated in these forward-
looking statements as a result of a number of factors, including those set forth under the sections entitled “Forward-
Looking Statements” and "Risk Factors" elsewhere in this report.
Our fiscal year ends on the Saturday nearest December 31st of each year, which results in an extra week every
several years (Fiscal 2008 contained 53 weeks). Our first quarter consists of 16 weeks, and the other three quarters
consist of 12 weeks, with the exception of the fourth quarter of Fiscal 2008 which contained 13 weeks due to our 53-
week Fiscal 2008.