Advance Auto Parts 2009 Annual Report Download - page 46
Download and view the complete annual report
Please find page 46 of the 2009 Advance Auto Parts annual report below. You can navigate through the pages in the report by either clicking on the pages listed below, or by using the keyword search tool below to find specific information within the annual report.-
 1
1 -
2
-
3
-
4
-
5
-
6
-
7
-
8
-
9
-
10
-
11
-
12
-
13
-
14
-
15
-
16
-
17
-
18
-
19
-
20
-
21
-
22
-
23
-
24
-
25
-
26
-
27
-
28
-
29
-
30
-
31
-
32
-
33
-
34
-
35
-
 36
36 -
 37
37 -
 38
38 -
 39
39 -
 40
40 -
 41
41 -
 42
42 -
 43
43 -
 44
44 -
 45
45 -
 46
46 -
 47
47 -
 48
48 -
 49
49 -
 50
50 -
 51
51 -
 52
52 -
 53
53 -
 54
54 -
 55
55 -
 56
56 -
57
-
58
-
59
-
60
-
61
-
62
-
63
-
64
-
65
-
66
-
67
-
68
-
69
-
70
-
71
-
72
-
73
-
74
-
75
-
76
-
77
-
78
-
79
-
80
-
81
-
82
-
83
-
84
-
85
-
86
-
87
-
88
-
89
-
90
-
91
-
92
-
93
-
94
-
95
-
96
-
97
-
98
-
99
-
100
-
101
-
102
-
103
-
104
-
105
-
106
-
107
-
108
-
109
-
110
-
111
-
112
 |
 |

33
Dividend
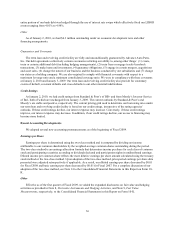
Our Board of Directors have paid quarterly dividends of $0.06 per share to stockholders of record since fiscal
2006. Subsequent to January 2, 2010, our Board of Directors declared a quarterly dividend of $0.06 per share to be
paid on April 9, 2010 to all common stockholders of record as of March 26, 2010.
Other Liquidity
During the last two years, we have transitioned certain of our merchandise vendors from a vendor financing
program to a customer-managed services arrangement, or vendor program. Under this vendor program, a third party
provides an accounts payable tracking system which facilitates the participating suppliers’ ability to finance our
payment obligations with designated third-party financial institutions. Participating suppliers may, at their sole
discretion, make offers to participating financial institutions to finance one or more of our payment obligations prior
to their scheduled due dates at a discounted price. Our obligations to suppliers, including amounts due and scheduled
payment dates, are not impacted by suppliers’ decisions to finance our accounts payable due to them under this
arrangement. Our goal in entering into this arrangement is to capture overall supply chain savings in the form of
pricing, payment terms or vendor funding, created by facilitating our suppliers’ ability to finance payment
obligations at more favorable discount rates, while providing them with greater working capital flexibility.
Any deterioration in the credit markets could adversely impact our ability to secure funding for any of these
programs, which would reduce our anticipated savings, including but not limited to, causing us to increase our
borrowings under our revolving credit facility.
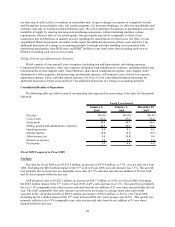
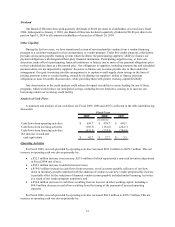
Analysis of Cash Flows
A summary and analysis of our cash flows for Fiscal 2009, 2008 and 2007 is reflected in the table and following
discussion.
2009 2008 2007
Cash flows from operating activities 699.7$ 478.7$ 410.5$
Cash flows from investing activities (185.5) (181.6) (202.1)
Cash flows from financing activities (451.5) (274.4) (204.9)
Net increase in cash and
cash equivalents 62.7$ 22.7$ 3.5$
Fiscal Year
(in millions)
Operating Activities
For Fiscal 2009, net cash provided by operating activities increased $221.0 million to $699.7 million. This net
increase in operating cash was driven primarily by:
• a $32.3 million increase in net income, $23.6 million of which represented a non-cash inventory adjustment
in Fiscal 2008 (net of tax);
• a $69.3 million increase in deferred income taxes;
• a $194.5 million increase in cash flows from inventory, net of accounts payable, reflective of our slow
down in inventory growth combined with the addition of vendors to our new vendor program (this increase
is partially offset by the reduction of financed vendor account payable included under Financing Activities
as a result of our vendor program transition); and
• a $56.6 million decrease in cash flows resulting from an increase in other working capital, including a
$64.0 million decrease in cash flows resulting from the timing of the payment of accrued operating
expenses.
For Fiscal 2008, net cash provided by operating activities increased $68.2 million to $478.7 million. This net
increase in operating cash was driven primarily by: