Advance Auto Parts 2009 Annual Report Download - page 37
Download and view the complete annual report
Please find page 37 of the 2009 Advance Auto Parts annual report below. You can navigate through the pages in the report by either clicking on the pages listed below, or by using the keyword search tool below to find specific information within the annual report.-
 1
1 -
2
-
3
-
4
-
5
-
6
-
7
-
8
-
9
-
10
-
11
-
12
-
13
-
14
-
15
-
16
-
17
-
18
-
19
-
20
-
21
-
22
-
23
-
24
-
25
-
26
-
 27
27 -
 28
28 -
 29
29 -
 30
30 -
 31
31 -
 32
32 -
 33
33 -
 34
34 -
 35
35 -
 36
36 -
 37
37 -
 38
38 -
 39
39 -
 40
40 -
 41
41 -
 42
42 -
 43
43 -
 44
44 -
 45
45 -
 46
46 -
 47
47 -
48
-
49
-
50
-
51
-
52
-
53
-
54
-
55
-
56
-
57
-
58
-
59
-
60
-
61
-
62
-
63
-
64
-
65
-
66
-
67
-
68
-
69
-
70
-
71
-
72
-
73
-
74
-
75
-
76
-
77
-
78
-
79
-
80
-
81
-
82
-
83
-
84
-
85
-
86
-
87
-
88
-
89
-
90
-
91
-
92
-
93
-
94
-
95
-
96
-
97
-
98
-
99
-
100
-
101
-
102
-
103
-
104
-
105
-
106
-
107
-
108
-
109
-
110
-
111
-
112
 |
 |

24
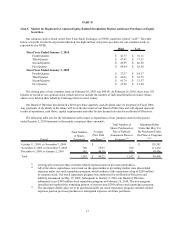
The net adjustment increasing cost of sales and decreasing SG&A was $63.9 million and $62.3 million for
Fiscal 2008 and 2007, respectively. For additional information regarding this change, see Note 3, Change in
Accounting Principle, of the Notes to Consolidated Financial Statements in this Annual Report on Form 10-K.
Industry
Challenging macroeconomic conditions continue with the unemployment rate at 9.7%, the highest in over 25
years, and consumer confidence remaining low. Financial results from the leading automotive aftermarket
companies suggest that the entire industry is benefiting from the economic downturn because consumers are keeping
their vehicles longer, which in turn increases the average age of vehicles and the need to repair and complete routine
maintenance on those vehicles. Recent statistics indicate miles driven have increased three straight quarters
reversing a negative trend throughout 2008 and early 2009. In addition, gas prices remain well under the historic
highs experienced throughout most of 2008 and the average vehicle age continues to rise and is slightly over 10
years.
In summary, the economic environment continues to present mixed results to our industry with opportunities to
serve customers in need of parts and other required maintenance but other elective maintenance and accessory
purchases being deferred until disposable income returns to higher levels. We believe we can maintain market share
and eventually increase our market share in the less fragmented DIY market. We also believe we will continue to
significantly increase our market share in the Commercial market where our current market share is less than 5% of
the $40 billion Commercial market.
We are pleased with our Fiscal 2009 financial results. We remain committed to making the necessary
investments to help ensure our long-term profitability and the success of our transformation as we strive to become
the industry leader.
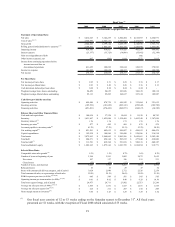
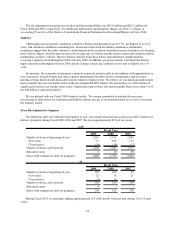
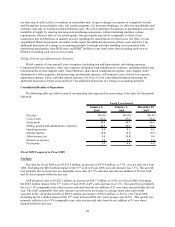
Store Development by Segment
The following table sets forth the total number of new, closed and relocated stores and stores with Commercial
delivery programs during Fiscal 2009, 2008 and 2007. We lease approximately 81% of our stores.
2009 2008 2007
Number of stores at beginning of year 3,243 3,153 2,995
New stores 75 109 175
Closed stores (54) (19) (17)
Number of stores, end of period 3,264 3,243 3,153
Relocated stores 6 10 29
Stores with commercial delivery programs 2,868 2,755 2,604
2009 2008 2007
Number of stores at beginning of year 125 108 87
New stores 32 18 21
Closed stores (1) (1) -
Number of stores, end of period 156 125 108
Relocated stores 4 - -
Stores with commercial delivery programs 156 125 108
AAP
Fiscal Year
AI
Fiscal Year
During Fiscal 2010, we anticipate adding approximately 110 AAP and 40 AI stores and closing 10 to 15 total
stores.