Advance Auto Parts 2009 Annual Report Download - page 30
Download and view the complete annual report
Please find page 30 of the 2009 Advance Auto Parts annual report below. You can navigate through the pages in the report by either clicking on the pages listed below, or by using the keyword search tool below to find specific information within the annual report.-
 1
1 -
2
-
3
-
4
-
5
-
6
-
7
-
8
-
9
-
10
-
11
-
12
-
13
-
14
-
15
-
16
-
17
-
18
-
19
-
 20
20 -
 21
21 -
 22
22 -
 23
23 -
 24
24 -
 25
25 -
 26
26 -
 27
27 -
 28
28 -
 29
29 -
 30
30 -
 31
31 -
 32
32 -
 33
33 -
 34
34 -
 35
35 -
 36
36 -
 37
37 -
 38
38 -
 39
39 -
 40
40 -
41
-
42
-
43
-
44
-
45
-
46
-
47
-
48
-
49
-
50
-
51
-
52
-
53
-
54
-
55
-
56
-
57
-
58
-
59
-
60
-
61
-
62
-
63
-
64
-
65
-
66
-
67
-
68
-
69
-
70
-
71
-
72
-
73
-
74
-
75
-
76
-
77
-
78
-
79
-
80
-
81
-
82
-
83
-
84
-
85
-
86
-
87
-
88
-
89
-
90
-
91
-
92
-
93
-
94
-
95
-
96
-
97
-
98
-
99
-
100
-
101
-
102
-
103
-
104
-
105
-
106
-
107
-
108
-
109
-
110
-
111
-
112
 |
 |

17
PART II
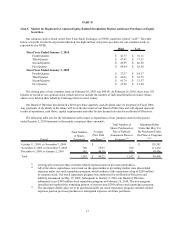
Item 5. Market for Registrant’s Common Equity, Related Stockholder Matters and Issuer Purchases of Equity
Securities.
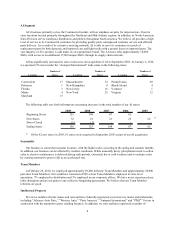
Our common stock is listed on the New York Stock Exchange, or NYSE, under the symbol "AAP." The table
below sets forth, for the fiscal periods indicated, the high and low sale prices per share for our common stock, as
reported by the NYSE.
High Low
Fiscal Year Ended January 2, 2010
Fourth Quarter 41.77$ 36.11$
Third Quarter 47.41$ 37.31$
Second Quarter 45.59$ 40.50$
First Quarter 44.64$ 29.50$
Fiscal Year Ended January 3, 2009
Fourth Quarter 37.37$ 24.17$
Third Quarter 44.61$ 36.75$
Second Quarter 41.74$ 33.57$
First Quarter 37.99$ 31.20$
The closing price of our common stock on February 26, 2010 was $40.80. At February 26, 2010, there were 363
holders of record of our common stock (which does not include the number of individual beneficial owners whose
shares were held on their behalf by brokerage firms in street name).
Our Board of Directors has declared a $0.06 per share quarterly cash dividend since its inception in Fiscal 2006.
Any payments of dividends in the future will be at the discretion of our Board of Directors and will depend upon our
results of operations, cash flows, capital requirements and other factors deemed relevant by our Board of Directors.
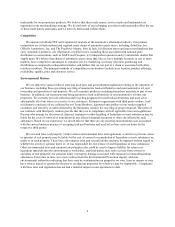
The following table sets for the information with respect to repurchases of our common stock for the quarter
ended January 2, 2010 (amounts in thousands, except per share amounts);
Period
Total Number
of Shares
Purchased
Average
Price Paid
per Share
(1)
Total Number of
Shares Purchased as
Part of Publicly
Announced Plans or
Programs
(2)
Maximum Dollar
Value that May Yet
Be Purchased Under
the Plans or Programs
(2)(3)
October 11, 2009, to November 7, 2009 - -$ - 139,381$
November 8, 2009, to December 5, 2009 700 39.93 700 111,422
December 6, 2009, to January 2, 2010 542 40.59 542 89,406
Total 1,242 40.22$ 1,242 89,406$
(1) Average price paid per share excludes related expenses paid on previous repurchases.
(2) All of the above repurchases were made on the open market at prevailing market rates plus related
expenses under our stock repurchase program, which authorized the repurchase of up to $250 million
in common stock. Our stock repurchase program was authorized by our Board of Directors and
publicly announced on May 15, 2008. Subsequent to January 2, 2010, our Board of Directors
authorized a new $500 million stock repurchase program on February 16, 2010. The new program
cancelled and replaced the remaining portion of our previous $250 million stock repurchase program.
(3) The maximum dollar value yet to be purchased under our stock repurchase program excludes related
expenses paid on previous purchases or anticipated expenses on future purchases.