Advance Auto Parts 2009 Annual Report Download - page 35
Download and view the complete annual report
Please find page 35 of the 2009 Advance Auto Parts annual report below. You can navigate through the pages in the report by either clicking on the pages listed below, or by using the keyword search tool below to find specific information within the annual report.-
 1
1 -
2
-
3
-
4
-
5
-
6
-
7
-
8
-
9
-
10
-
11
-
12
-
13
-
14
-
15
-
16
-
17
-
18
-
19
-
20
-
21
-
22
-
23
-
24
-
 25
25 -
 26
26 -
 27
27 -
 28
28 -
 29
29 -
 30
30 -
 31
31 -
 32
32 -
 33
33 -
 34
34 -
 35
35 -
 36
36 -
 37
37 -
 38
38 -
 39
39 -
 40
40 -
 41
41 -
 42
42 -
 43
43 -
 44
44 -
 45
45 -
46
-
47
-
48
-
49
-
50
-
51
-
52
-
53
-
54
-
55
-
56
-
57
-
58
-
59
-
60
-
61
-
62
-
63
-
64
-
65
-
66
-
67
-
68
-
69
-
70
-
71
-
72
-
73
-
74
-
75
-
76
-
77
-
78
-
79
-
80
-
81
-
82
-
83
-
84
-
85
-
86
-
87
-
88
-
89
-
90
-
91
-
92
-
93
-
94
-
95
-
96
-
97
-
98
-
99
-
100
-
101
-
102
-
103
-
104
-
105
-
106
-
107
-
108
-
109
-
110
-
111
-
112
 |
 |

22
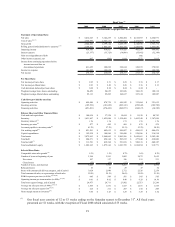
repurchase 2.5 million shares of our common stock at a cost of $99.6 million.
General
• Our continuous improvements in customer satisfaction and Team Member engagement scores, renewed
focus on core values and ongoing initiatives within each of our four key strategies – Commercial
Acceleration, DIY Transformation, Availability Excellence and Superior Experience – were equally
important in driving our favorable financial results for the year.
• We began our global sourcing operation in Taiwan which we expect will provide gross profit
improvements and allow us to more quickly source products that our customers want and need.
• We launched our new AAP e-commerce website, which offers our customers online shopping and access to
over 100,000 parts and accessories.
• We continued to make progress towards our goal of obtaining investment grade credit ratings based on our
increased profitability and cash flow and strength of our balance sheet.
Key Strategies
Fiscal 2009 marked the end of the turnaround phase of our strategic plan. We made significant investments in
each of our four key strategies with the ultimate focus on the customer and growth in our business. Our principal
focus during this turnaround phase has been on Commercial Acceleration and Availability Excellence to accelerate
our growth and profitability. We have made strategic choices to fund investments in each of these strategies and will
continue to balance our investments between Commercial and DIY over the long term. As we transition from our
turnaround phase to a transformation phase, we expect to increase our focus on customer facing capabilities to
ensure our customers have a superior experience with us.
¾ Commercial Acceleration
Our Commercial comparable store sales increase was 13.7% during Fiscal 2009. Our Commercial sales, as a
percentage of total sales, increased 25 basis points to 32.0% for Fiscal 2009 as compared to Fiscal 2008. We believe
our consistent growth in Commercial sales and market share is being driven in part by the investments we have
made over the last year and continue to make under our Commercial Acceleration strategy. As of the end of Fiscal
2009, we have made substantial investments in parts, key brands, and additional parts professionals, delivery trucks
and drivers in approximately one-third of our stores. We have also increased our Commercial sales force by
approximately 45% from the beginning of Fiscal 2009. We continue to make progress in redefining and realigning
the roles and responsibilities of our operational teams in preparation for the continued growth in Commercial at a
faster pace than DIY. We plan to eventually generate closer to a 50/50 mix of Commercial and DIY sales as a result
of the highly fragmented Commercial market. Our current market share is less than 5% of the $40 billion
Commercial market.
¾ DIY Transformation
Our Fiscal 2009 DIY comparable store sales increase of 1.7% marks our first positive increase for a full fiscal
year since Fiscal 2005. The overall growth in DIY sales during Fiscal 2009 was impacted by the acceleration of
store closings, the deceleration of new store openings, reduced marketing spend in the second and third quarters, and
the absence of an E-commerce platform. The industry continues to benefit from increased customer traffic as
consumers are saving money by maintaining their existing vehicles rather than replacing them and miles driven have
started to increase again. Although industry data reported by The NPD Group indicates the market grew slightly
faster than we did during Fiscal 2009, we believe we can maintain and eventually increase DIY market share based
on our recently revamped marketing programs and other initiatives underway in our DIY Transformation.
We have initiatives underway to address both the conversion rate of our existing customers as well as the
consideration rate of potential customers. Conversion rate initiatives include the installation of traffic counters and
updated phone systems to provide valuable information about the customer experience, improved staffing and