Advance Auto Parts 2009 Annual Report Download - page 41
Download and view the complete annual report
Please find page 41 of the 2009 Advance Auto Parts annual report below. You can navigate through the pages in the report by either clicking on the pages listed below, or by using the keyword search tool below to find specific information within the annual report.-
 1
1 -
2
-
3
-
4
-
5
-
6
-
7
-
8
-
9
-
10
-
11
-
12
-
13
-
14
-
15
-
16
-
17
-
18
-
19
-
20
-
21
-
22
-
23
-
24
-
25
-
26
-
27
-
28
-
29
-
30
-
 31
31 -
 32
32 -
 33
33 -
 34
34 -
 35
35 -
 36
36 -
 37
37 -
 38
38 -
 39
39 -
 40
40 -
 41
41 -
 42
42 -
 43
43 -
 44
44 -
 45
45 -
 46
46 -
 47
47 -
 48
48 -
 49
49 -
 50
50 -
 51
51 -
52
-
53
-
54
-
55
-
56
-
57
-
58
-
59
-
60
-
61
-
62
-
63
-
64
-
65
-
66
-
67
-
68
-
69
-
70
-
71
-
72
-
73
-
74
-
75
-
76
-
77
-
78
-
79
-
80
-
81
-
82
-
83
-
84
-
85
-
86
-
87
-
88
-
89
-
90
-
91
-
92
-
93
-
94
-
95
-
96
-
97
-
98
-
99
-
100
-
101
-
102
-
103
-
104
-
105
-
106
-
107
-
108
-
109
-
110
-
111
-
112
 |
 |

28
net sales may be affected by (i) variations in our product mix, (ii) price changes in response to competitive factors
and fluctuations in merchandise costs, (iii) vendor programs, (iv) inventory shrinkage, (v) defective merchandise and
warranty costs and (v) warehouse and distribution costs. We seek to minimize fluctuations in merchandise costs and
instability of supply by entering into long-term purchasing agreements, without minimum purchase volume
requirements, when we believe it is advantageous. Our gross profit may not be comparable to those of our
competitors due to differences in industry practice regarding the classification of certain costs. See Note 2 to our
consolidated financial statements elsewhere in this report for additional discussion of these costs and Note 3 for
additional discussion of a change in accounting principle for freight and other handling costs associated with
transferring merchandise from HUB stores and PDQ® facilities to our retail stores from recording such costs as
SG&A to recording such costs in cost of sales.
Selling, General and Administrative Expenses
SG&A consists of store payroll, store occupancy (including rent and depreciation), advertising expenses,
Commercial delivery expenses, other store expenses and general and administrative expenses, including salaries and
related benefits of store support center Team Members, share-based compensation expense, store support center
administrative office expenses, data processing, professional expenses, self-insurance costs, closed store expense,
impairment charges, if any, and other related expenses. See Note 2 to our consolidated financial statements for
additional discussion of these costs and Note 3 for additional discussion of a change in accounting principle.
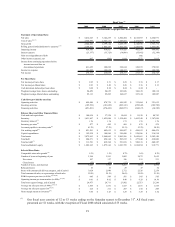
Consolidated Results of Operations
The following table sets forth certain of our operating data expressed as a percentage of net sales for the periods
indicated.
January 2, January 3, December 29,
2010 2009 2007
Net sales 100.0% 100.0% 100.0%
Cost of sales 51.1 53.3 53.4
Gross profit 48.9 46.7 46.6
Selling, general and administrative expenses 40.5 38.6 38.0
Operating income 8.4 8.1 8.6
Interest expense (0.4) (0.7) (0.7)
Other income, net 0.0 (0.0) 0.0
Income tax expense 3.0 2.8 3.0
Net income 5.0 4.6 4.9
Fiscal Year Ended
Fiscal 2009 Compared to Fiscal 2008
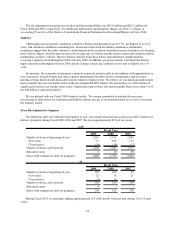
Net Sales
Net sales for Fiscal 2009 were $5,412.6 million, an increase of $270.4 million, or 5.3%, over net sales for Fiscal
2008. Excluding the $88.8 million impact of the 53rd week in Fiscal 2008, our sales increase was 7.1%. This growth
was primarily due to an increase in comparable store sales of 5.3% and sales from the net addition of 52 new AAP
and AI stores opened within the last year.
AAP produced sales of $5,218.3 million, an increase of $241.7 million, or 4.9%, over Fiscal 2008. Excluding
the $86.5 million impact of the 53rd week in Fiscal 2008, AAP’s sales increase was 6.7%. This growth was primarily
due to a 5.1% comparable store sales increase and sales from the net addition of 21 new stores opened within the last
year. The AAP comparable store sales increase was driven by an increase in average ticket sales and overall
customer traffic. AI produced sales of $202.6 million, an increase of $36.9 million, or 22.3%, over Fiscal 2008.
Excluding the $2.3 million impact of the 53rd week in Fiscal 2008, AI’s sales increase was 24.0%. This growth was
primarily reflective of a 9.9% comparable store sales increase and sales from the net addition of 31 new stores
opened within the last year.