Advance Auto Parts 2009 Annual Report Download - page 78
Download and view the complete annual report
Please find page 78 of the 2009 Advance Auto Parts annual report below. You can navigate through the pages in the report by either clicking on the pages listed below, or by using the keyword search tool below to find specific information within the annual report.-
 1
1 -
2
-
3
-
4
-
5
-
6
-
7
-
8
-
9
-
10
-
11
-
12
-
13
-
14
-
15
-
16
-
17
-
18
-
19
-
20
-
21
-
22
-
23
-
24
-
25
-
26
-
27
-
28
-
29
-
30
-
31
-
32
-
33
-
34
-
35
-
36
-
37
-
38
-
39
-
40
-
41
-
42
-
43
-
44
-
45
-
46
-
47
-
48
-
49
-
50
-
51
-
52
-
53
-
54
-
55
-
56
-
57
-
58
-
59
-
60
-
61
-
62
-
63
-
64
-
65
-
66
-
67
-
 68
68 -
 69
69 -
 70
70 -
 71
71 -
 72
72 -
 73
73 -
 74
74 -
 75
75 -
 76
76 -
 77
77 -
 78
78 -
 79
79 -
 80
80 -
 81
81 -
 82
82 -
 83
83 -
 84
84 -
 85
85 -
 86
86 -
 87
87 -
 88
88 -
89
-
90
-
91
-
92
-
93
-
94
-
95
-
96
-
97
-
98
-
99
-
100
-
101
-
102
-
103
-
104
-
105
-
106
-
107
-
108
-
109
-
110
-
111
-
112
 |
 |

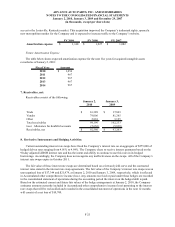
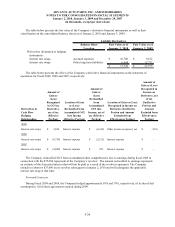
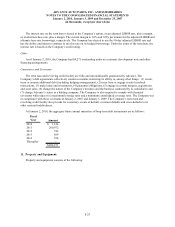
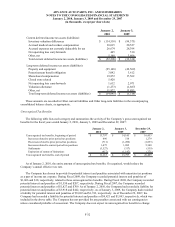
ADVANCE AUTO PARTS, INC. AND SUBSIDIARIES
NOTES TO THE CONSOLIDATED FINANCIAL STATEMENTS
January 2, 2010, January 3, 2009 and December 29, 2007
(in thousands, except per share data)
.
F-25
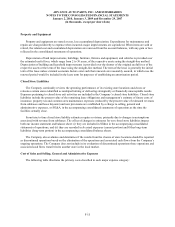
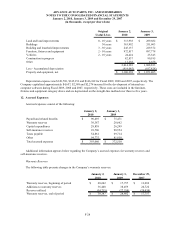
9. Fair Value Measurements:
The Company’s financial assets and liabilities measured at fair value are grouped in three levels. The levels
prioritize the inputs used to measure the fair value of these assets or liabilities. These levels are:
• Level 1 – Unadjusted quoted prices that are available in active markets for identical assets or
liabilities at the measurement date.
• Level 2 – Inputs other than quoted prices that are observable for assets and liabilities at the
measurement date, either directly or indirectly. These inputs include quoted prices for similar assets
or liabilities in active markets, quoted prices for identical or similar assets or liabilities in markets that
are less active, inputs other than quoted prices that are observable for the asset or liability or
corroborated by other observable market data.
• Level 3 – Unobservable inputs for assets or liabilities that are not able to be corroborated by
observable market data and reflect the use of a reporting entity’s own assumptions. These values are
generally determined using pricing models for which the assumptions utilize management’s estimates
of market participant assumptions.
Assets and Liabilities Measured at Fair Value on a Recurring Basis
The fair value hierarchy requires the use of observable market data when available. In instances where inputs
used to measure fair value fall into different levels of the fair value hierarchy, the fair value measurement has been
determined based on the lowest level input that is significant to the fair value measurement in its entirety. Our
assessment of the significance of a particular item to the fair value measurement in its entirety requires judgment,
including the consideration of inputs specific to the asset or liability.
The following table sets forth the Company’s financial liabilities that were measured at fair value on a recurring
basis during the 2009 fiscal year, including at January 2, 2010:
Level 1 Level 2 Level 3
Quoted Prices in Significant
Fair Value at Active Markets for Significant Other Unobservable
January 2, 2010 Identical Assets Observable Inputs Inputs
Interest rate swaps 17,344$ -$ 17,344$ -$
Fair Value Measurements at Reporting Date Using
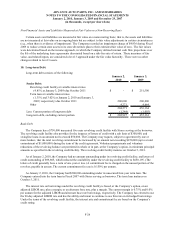
The fair value of these interest rate swaps at January 2, 2010 and January 3, 2009, respectively, was an
unrecognized loss of $17,344 and $21,979. The fair value of the Company’s interest rate swaps is mainly based on
observable interest rate yield curves for similar instruments.
The carrying amount of the Company’s cash and cash equivalents, accounts receivable, bank overdrafts,
financed vendor accounts payable, accounts payable, accrued expenses and current portion of long term debt
approximate their fair values due to the relatively short term nature of these instruments. As of January 2, 2010 and
January 3, 2009, the fair value of the Company’s long-term debt with a carrying value of $202,927 and $455,161,
respectively, was approximately $195,000 and $374,000, respectively, and was based on similar long-term debt
issues available to the Company as of that date. The fair value of the Company’s fixed rate debt was determined by
using an assumed market interest rate commensurate with the Company’s credit risk.