Advance Auto Parts 2009 Annual Report Download - page 91
Download and view the complete annual report
Please find page 91 of the 2009 Advance Auto Parts annual report below. You can navigate through the pages in the report by either clicking on the pages listed below, or by using the keyword search tool below to find specific information within the annual report.-
 1
1 -
2
-
3
-
4
-
5
-
6
-
7
-
8
-
9
-
10
-
11
-
12
-
13
-
14
-
15
-
16
-
17
-
18
-
19
-
20
-
21
-
22
-
23
-
24
-
25
-
26
-
27
-
28
-
29
-
30
-
31
-
32
-
33
-
34
-
35
-
36
-
37
-
38
-
39
-
40
-
41
-
42
-
43
-
44
-
45
-
46
-
47
-
48
-
49
-
50
-
51
-
52
-
53
-
54
-
55
-
56
-
57
-
58
-
59
-
60
-
61
-
62
-
63
-
64
-
65
-
66
-
67
-
68
-
69
-
70
-
71
-
72
-
73
-
74
-
75
-
76
-
77
-
78
-
79
-
80
-
 81
81 -
 82
82 -
 83
83 -
 84
84 -
 85
85 -
 86
86 -
 87
87 -
 88
88 -
 89
89 -
 90
90 -
 91
91 -
 92
92 -
 93
93 -
 94
94 -
 95
95 -
 96
96 -
 97
97 -
 98
98 -
 99
99 -
 100
100 -
 101
101 -
102
-
103
-
104
-
105
-
106
-
107
-
108
-
109
-
110
-
111
-
112
 |
 |

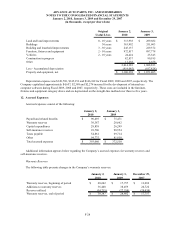
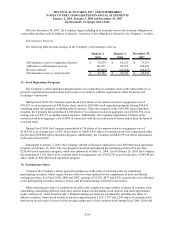
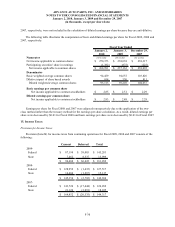
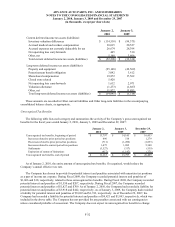
ADVANCE AUTO PARTS, INC. AND SUBSIDIARIES
NOTES TO THE CONSOLIDATED FINANCIAL STATEMENTS
January 2, 2010, January 3, 2009 and December 29, 2007
(in thousands, except per share data)
.
F-38
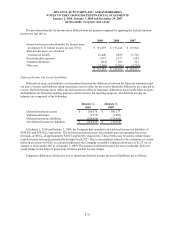
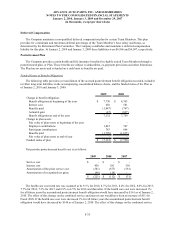
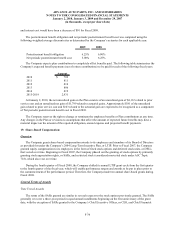
Black-Scholes Option Valuation Assumptions (1) 2009 2008 2007
Risk-free interest rate (2) 1.6% 2.5% 4.8%
Expected dividend yield 0.6% 0.8% 0.6%
Expected stock price volatility (3) 39.2% 32.3% 29.0%
Expected life of awards (in months) (4) 50 50 51
(1) Forfeitures are based on historical experience.
(2) The risk-free interest rate is based on a U.S. Treasury constant maturity interest rate whose term is consistent
with the expected life of the Company’s awards.
(3) Expected volatility is based on the historical volatility of the Company’s common stock for the period
consistent with the expected life of the Company’s awards.
(4) The expected life of the Company’s awards represents the estimated period of time until exercise and is based
on historical experience of previously granted awards.
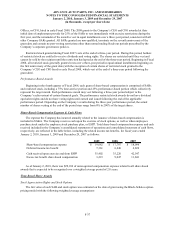
The following table summarizes the time-vested fixed stock option and time-vested SARs activity for the fiscal
year ended January 2, 2010:
Number of
Awards
Weighted-
Average
Exercise Price
Weighted-
Average
Remaining
Contractual
Term (in years)
Aggregate
Intrinsic Value
Outstanding at January 3, 2009 6,254 33.95$
Granted 519 40.79
Exercised (1,249) 31.38
Forfeited (248) 33.96
Outstanding at January 2, 2010 5,276 35.20$ 4.33 28,313$
Vested and expected to ves
t
5,076 35.22$ 4.26 27,098$
Outstanding and exercisable 3,132 35.60$ 3.47 15,379$
The weighted average fair value of SARs and stock options granted during the fiscal years ended January 2,
2010, January 3, 2009 and December 29, 2007, was $12.98, $8.66 and $11.39 per share, respectively. The aggregate
intrinsic value reflected in the table is based on the Company’s closing stock price of $40.48 as of the last trading
day of the period ended January 2, 2010. The aggregate intrinsic value of options and SARs (the amount by which
the market price of the stock on the date of exercise exceeded the exercise price) exercised during the fiscal years
ended January 2, 2010, January 3, 2009 and December 29, 2007, was $12,704, $25,890 and $33,179, respectively.