Advance Auto Parts 2009 Annual Report Download - page 83
Download and view the complete annual report
Please find page 83 of the 2009 Advance Auto Parts annual report below. You can navigate through the pages in the report by either clicking on the pages listed below, or by using the keyword search tool below to find specific information within the annual report.-
 1
1 -
2
-
3
-
4
-
5
-
6
-
7
-
8
-
9
-
10
-
11
-
12
-
13
-
14
-
15
-
16
-
17
-
18
-
19
-
20
-
21
-
22
-
23
-
24
-
25
-
26
-
27
-
28
-
29
-
30
-
31
-
32
-
33
-
34
-
35
-
36
-
37
-
38
-
39
-
40
-
41
-
42
-
43
-
44
-
45
-
46
-
47
-
48
-
49
-
50
-
51
-
52
-
53
-
54
-
55
-
56
-
57
-
58
-
59
-
60
-
61
-
62
-
63
-
64
-
65
-
66
-
67
-
68
-
69
-
70
-
71
-
72
-
 73
73 -
 74
74 -
 75
75 -
 76
76 -
 77
77 -
 78
78 -
 79
79 -
 80
80 -
 81
81 -
 82
82 -
 83
83 -
 84
84 -
 85
85 -
 86
86 -
 87
87 -
 88
88 -
 89
89 -
 90
90 -
 91
91 -
 92
92 -
 93
93 -
94
-
95
-
96
-
97
-
98
-
99
-
100
-
101
-
102
-
103
-
104
-
105
-
106
-
107
-
108
-
109
-
110
-
111
-
112
 |
 |

ADVANCE AUTO PARTS, INC. AND SUBSIDIARIES
NOTES TO THE CONSOLIDATED FINANCIAL STATEMENTS
January 2, 2010, January 3, 2009 and December 29, 2007
(in thousands, except per share data)
.
F-30
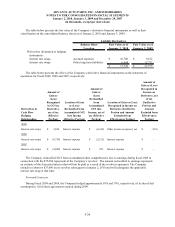
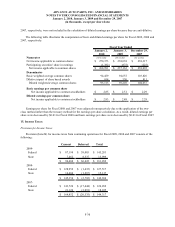
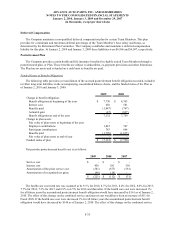
2007, respectively, were not included in the calculation of diluted earnings per share because they are anti-dilutive.
The following table illustrates the computation of basic and diluted earnings per share for Fiscal 2009, 2008 and
2007, respectively:
January 2, January 3, December 29,
2010 2009 2007
Numerator
(52 weeks) (53 weeks) (52 weeks)
Net income applicable to common shares 270,373$ 238,038$ 238,317$
Participating securities' share in earnings (1,382) (875) (225)
Net income applicable to common shares 268,991$ 237,163$ 238,092$
Denominator
Basic weighted average common shares 94,459 94,655 103,826
Dilutive impact of share based awards 654 550 811
Diluted weighted average common shares 95,113 95,205 104,637
Basic earnings per common share
Net income applicable to common stockholders 2.85$ 2.51$ 2.29$
Diluted earnings per common share
Net income applicable to common stockholders 2.83$ 2.49$ 2.28$
Fiscal Year Ended
Earnings per share for Fiscal 2008 and 2007 were adjusted retrospectively due to the application of the two-
class method rather than the treasury method for the earnings per share calculation. As a result, diluted earnings per
share were decreased by $0.01 for Fiscal 2008 and basic earnings per share were decreased by $0.01 for Fiscal 2007.
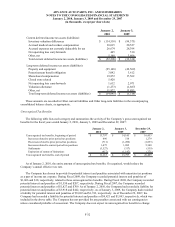
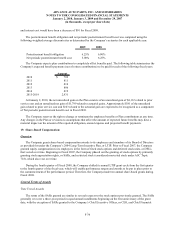
15. Income Taxes:
Provision for Income Taxes
Provision (benefit) for income taxes from continuing operations for Fiscal 2009, 2008 and 2007 consists of the
following:
Current Deferred Total
2009-
Federal 87,198$ 58,085$ 145,283$
State 7,462 8,537 15,999
94,660$ 66,622$ 161,282$
2008-
Federal 128,952$ (1,435)$ 127,517$
State 16,404 (1,267) 15,137
145,356$ (2,702)$ 142,654$
2007-
Federal 143,726$ (17,444)$ 126,282$
State 21,126 (3,091) 18,035
164,852$ (20,535)$ 144,317$