Advance Auto Parts 2009 Annual Report Download - page 92
Download and view the complete annual report
Please find page 92 of the 2009 Advance Auto Parts annual report below. You can navigate through the pages in the report by either clicking on the pages listed below, or by using the keyword search tool below to find specific information within the annual report.-
 1
1 -
2
-
3
-
4
-
5
-
6
-
7
-
8
-
9
-
10
-
11
-
12
-
13
-
14
-
15
-
16
-
17
-
18
-
19
-
20
-
21
-
22
-
23
-
24
-
25
-
26
-
27
-
28
-
29
-
30
-
31
-
32
-
33
-
34
-
35
-
36
-
37
-
38
-
39
-
40
-
41
-
42
-
43
-
44
-
45
-
46
-
47
-
48
-
49
-
50
-
51
-
52
-
53
-
54
-
55
-
56
-
57
-
58
-
59
-
60
-
61
-
62
-
63
-
64
-
65
-
66
-
67
-
68
-
69
-
70
-
71
-
72
-
73
-
74
-
75
-
76
-
77
-
78
-
79
-
80
-
81
-
 82
82 -
 83
83 -
 84
84 -
 85
85 -
 86
86 -
 87
87 -
 88
88 -
 89
89 -
 90
90 -
 91
91 -
 92
92 -
 93
93 -
 94
94 -
 95
95 -
 96
96 -
 97
97 -
 98
98 -
 99
99 -
 100
100 -
 101
101 -
 102
102 -
103
-
104
-
105
-
106
-
107
-
108
-
109
-
110
-
111
-
112
 |
 |

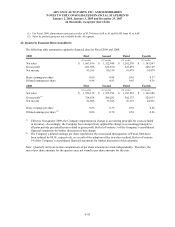
ADVANCE AUTO PARTS, INC. AND SUBSIDIARIES
NOTES TO THE CONSOLIDATED FINANCIAL STATEMENTS
January 2, 2010, January 3, 2009 and December 29, 2007
(in thousands, except per share data)
.
F-39
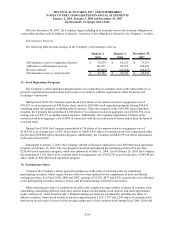
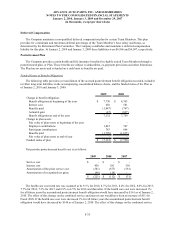
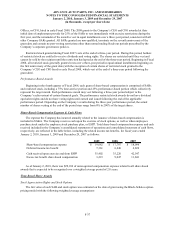
Restricted Stock
The following table summarizes the restricted stock activity for the fiscal year ended January 2, 2010:
Number of
Awards
Weighted-
Average Grant
Date Fair Value
Nonvested at January 3, 2009 555 33.28$
Granted 148 39.53
Vested (107) 37.86
Forfeited (37) 34.50
Nonvested at January 2, 2010 559 35.40$
The fair value of each share of restricted stock is determined based on the market price of the Company’s
common stock on the date of grant. The weighted average fair value of shares granted during Fiscal 2009 and 2008
was $39.53 and $32.21 per share, respectively. The total grant date fair value of shares vested during Fiscal 2009
and 2008 was approximately $3,238 and $53, respectively.
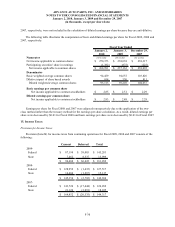
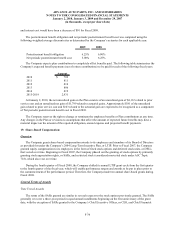
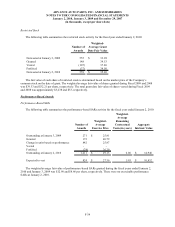
Performance-Based Awards
Performance-Based SARs
The following table summarizes the performance-based SARs activity for the fiscal year ended January 2, 2010:
Number of
Awards
Weighted-
Average
Exercise Price
Weighted-
Average
Remaining
Contractual
Term (in years)
Aggregate
Intrinsic Value
Outstanding at January 3, 2009 271 25.81$
Granted 172 40.79
Change in units based on performance 842 25.87
Vested - -
Forfeited (74) 26.29
Outstanding at January 2, 2010 1,211 29.13$ 6.06 14,946$
Expected to ves
t
824 27.56$ 5.95 10,852$
The weighted average fair value of performance-based SARs granted during the fiscal years ended January 2,
2010 and January 3, 2009 was $12.98 and $8.66 per share, respectively. There were no exercisable performance
SARs at January 2, 2010.