Advance Auto Parts 2009 Annual Report Download - page 8
Download and view the complete annual report
Please find page 8 of the 2009 Advance Auto Parts annual report below. You can navigate through the pages in the report by either clicking on the pages listed below, or by using the keyword search tool below to find specific information within the annual report.-
 1
1 -
 2
2 -
 3
3 -
 4
4 -
 5
5 -
 6
6 -
 7
7 -
 8
8 -
 9
9 -
 10
10 -
 11
11 -
 12
12 -
 13
13 -
 14
14 -
 15
15 -
 16
16 -
 17
17 -
 18
18 -
 19
19 -
20
-
21
-
22
-
23
-
24
-
25
-
26
-
27
-
28
-
29
-
30
-
31
-
32
-
33
-
34
-
35
-
36
-
37
-
38
-
39
-
40
-
41
-
42
-
43
-
44
-
45
-
46
-
47
-
48
-
49
-
50
-
51
-
52
-
53
-
54
-
55
-
56
-
57
-
58
-
59
-
60
-
61
-
62
-
63
-
64
-
65
-
66
-
67
-
68
-
69
-
70
-
71
-
72
-
73
-
74
-
75
-
76
-
77
-
78
-
79
-
80
-
81
-
82
-
83
-
84
-
85
-
86
-
87
-
88
-
89
-
90
-
91
-
92
-
93
-
94
-
95
-
96
-
97
-
98
-
99
-
100
-
101
-
102
-
103
-
104
-
105
-
106
-
107
-
108
-
109
-
110
-
111
-
112
 |
 |
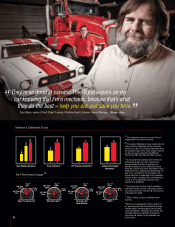
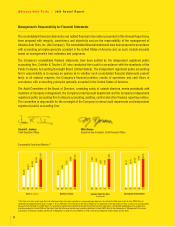
Retention & Satisfaction Scores
(1)
Team Calibration measures our overall Team’s
engagement in our business direction.
(2)
The Customer Satisfaction surveys measure the level
of our customers’ satisfaction with the service they
receive in our stores. The Customer Satisfaction scores
are calculated using a twelve-month average. However,
our first survey was conducted in fall 2008 and
therefore the 2008 score does not reflect a full year.
(3)
Our financial results reported in the referenced
performance gauges have been reported on a
comparable operating basis to exclude store
divestiture expenses in fiscal 2009 and the 53rd
week and a non-cash inventory adjustment in fiscal
2008. Refer to the “Selected Consolidated Data” on
page 17 of our 2009 Form 10-K included in this
Annual Report for an explanation of the calculation
of these metrics, excluding ROIC as defined below,
as well as the corresponding financial results
reported on a GAAP basis.
(4)
Top 3 represents the three largest automotive
aftermarket retailers of parts, accessories, batteries
and maintenance items measured by store count as
of December 31, 2009.
(5)
SG&A – Selling, General and Administrative
expenses.
(6)
Return on invested capital (ROIC) is defined as
net operating profit after taxes divided by average
invested capital. Invested capital consists of total
assets and liabilities, excluding cash and debt, and
estimated capital lease obligation calculated as
annualized rent expense for the applicable year
times 6 years.
The 4 Performance Gauges
(3)
40%
07 08 09 08 09
61%
66%
65%
75%
08 09
65
73
08 09
60
64
6
Op Income Per
Team Member
Sales Per Square Foot SG&A Per Store
(5)
ROIC%
(6)
DIY Customer Satisfaction
(2)
Team Member Retention Team Calibration
(1)
Commercial Customer
Satisfaction
(2)
Top 3
$14k
Leader
$20k
AAP 2009
$9.9k
AAP 2008
$9.5k
AAP 2009
$218
Top 3
$222
Leader
$241
AAP 2008
$208
Top 3
$560k
AAP 2008
$590k
AAP 2009
$638k
Leader
$522k
Top 3
16.6%
AAP 2009
15.1% Leader
26.1%
AAP 2008
14.0%
(4) (4) (4) (4)
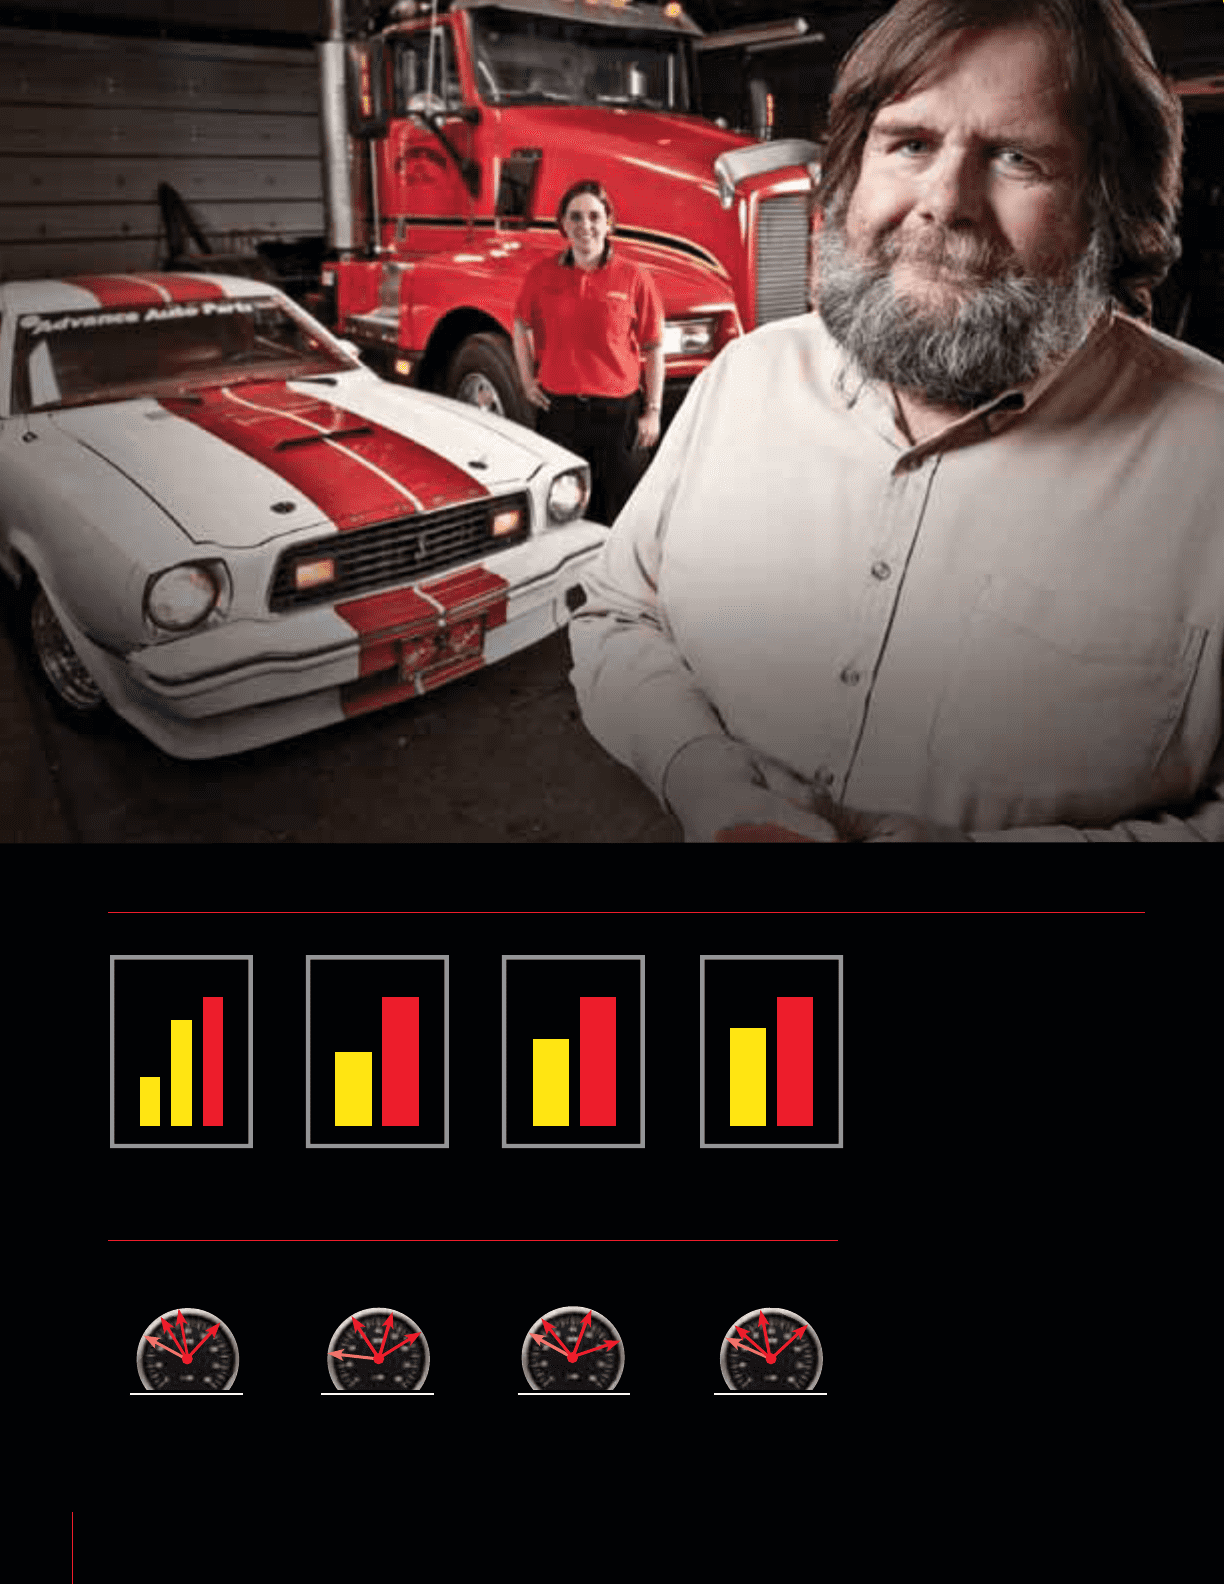
“”
They’re so good at service. They’ll put wipers on my
car knowing that I’m a mechanic, because that’s what
they do the best – help you out and save you time.
Daryl Moss, owner of Front Street Trucking; Christine Everett, Advance General Manager | Niles, Ohio