Advance Auto Parts 2009 Annual Report Download - page 42
Download and view the complete annual report
Please find page 42 of the 2009 Advance Auto Parts annual report below. You can navigate through the pages in the report by either clicking on the pages listed below, or by using the keyword search tool below to find specific information within the annual report.-
 1
1 -
2
-
3
-
4
-
5
-
6
-
7
-
8
-
9
-
10
-
11
-
12
-
13
-
14
-
15
-
16
-
17
-
18
-
19
-
20
-
21
-
22
-
23
-
24
-
25
-
26
-
27
-
28
-
29
-
30
-
31
-
 32
32 -
 33
33 -
 34
34 -
 35
35 -
 36
36 -
 37
37 -
 38
38 -
 39
39 -
 40
40 -
 41
41 -
 42
42 -
 43
43 -
 44
44 -
 45
45 -
 46
46 -
 47
47 -
 48
48 -
 49
49 -
 50
50 -
 51
51 -
 52
52 -
53
-
54
-
55
-
56
-
57
-
58
-
59
-
60
-
61
-
62
-
63
-
64
-
65
-
66
-
67
-
68
-
69
-
70
-
71
-
72
-
73
-
74
-
75
-
76
-
77
-
78
-
79
-
80
-
81
-
82
-
83
-
84
-
85
-
86
-
87
-
88
-
89
-
90
-
91
-
92
-
93
-
94
-
95
-
96
-
97
-
98
-
99
-
100
-
101
-
102
-
103
-
104
-
105
-
106
-
107
-
108
-
109
-
110
-
111
-
112
 |
 |

29
Gross Profit
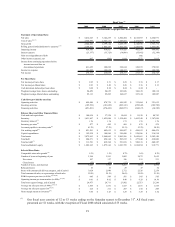
Gross profit for Fiscal 2009 was $2,644.2 million, or 48.9% of net sales, as compared to $2,399.1 million, or
46.7% of net sales, in Fiscal 2008, or an increase of 220 basis points. Excluding the impacts of the $37.5 million
non-cash inventory adjustment and the 53rd week in Fiscal 2008, the increase in gross profit rate was 149 basis
points. This increase in gross profit as a percentage of net sales was primarily due to continued investments in
pricing and merchandising capabilities (including global sourcing), increased parts availability resulting in the sale
of more parts which generally contribute a higher gross profit and improved store execution partially offset by
decreased inventory shrink.
SG&A
SG&A expenses for Fiscal 2009 were $2,189.8 million, or 40.5% of net sales, as compared to $1,984.2 million,
or 38.6% of net sales, for Fiscal 2008, or an increase of 187 basis points. Store divestiture expenses comprised 48
basis points of the increase in SG&A as a percentage of net sales. The remaining increase was primarily due to:
• increased investments in store labor and Commercial sales force;
• higher incentive compensation driven by the favorable financial results in fiscal 2009; and
• continued investments to improve our gross profit rate and to operate our new e-commerce operation.
These increases were partially offset by lower advertising expenses and occupancy expense leverage. Excluding
store divestitures, this increase in SG&A is primarily linked to the targeted investments we are making to support
each of our four key strategies which have already begun to yield benefits in our sales and gross profit results. While
our transformation will require continued investments in areas such as Commercial, e-commerce and global
sourcing, management plans to balance increases in fixed and variable SG&A relative to our sales growth.
Operating Income
Operating income for Fiscal 2009 was $454.4 million, or 8.4% of net sales, as compared to $414.9 million, or
8.1% of net sales, in Fiscal 2008, or an increase of 33 basis points. This increase in operating income, as a
percentage of net sales, reflects an increase in gross profit partially offset by higher SG&A. The increase in SG&A
reflects many of the investments we are making in our business with short-term benefits already being realized in
net sales and gross profit resulting in an overall net increase in profitability. The Fiscal 2009 increase in our
operating income also benefited from the $37.5 million non-cash inventory adjustment, partially offset by the
approximately $15.8 million impact from the 53rd week, in Fiscal 2008.
AAP produced operating income of $446.8 million, or 8.6% of net sales, for Fiscal 2009 as compared to $410.7
million, or 8.3% of net sales, in Fiscal 2008. AI generated operating income for Fiscal 2009 of $7.6 million as
compared to $4.2 million in Fiscal 2008. AI’s operating income increased primarily due to its positive sales results
for the year and leverage of supply chain costs as a percentage of net sales.
Interest Expense
Interest expense for Fiscal 2009 was $23.3 million, or 0.4% of net sales, as compared to $33.7 million, or 0.7%
of net sales, in Fiscal 2008. The decrease in interest expense as a percentage of sales is primarily a result of lower
outstanding borrowings and increased sales during Fiscal 2009.
Income Taxes
Income tax expense for Fiscal 2009 was $161.3 million, as compared to $142.7 million for Fiscal 2008. Our
effective income tax rate was 37.4% and 37.5% for Fiscal 2009 and Fiscal 2008, respectively.